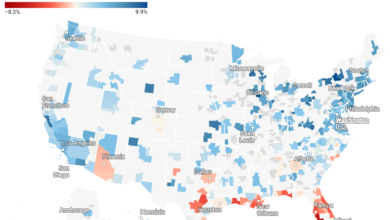
Bay Area (California) Homeownership Rate and Number of Household by ZIP Code – 2024

The dream of owning a home in the Bay Area remains a significant aspiration for many.
A recent analysis of 2024 data reveals a diverse landscape of homeownership rates and household numbers across different zip codes in this highly sought-after region. From the bustling urban centers to the more suburban and rural pockets, the data paints a nuanced picture of who owns and where they live.
High Homeownership Concentrations:
Several zip codes exhibit remarkably high homeownership rates, often exceeding 80%. These areas suggest established communities with a strong prevalence of owner-occupied housing. Notable examples include:
- 94506 (Alamo): Boasting an impressive 89.2% homeownership rate, with 7,383 out of an estimated 8,277 households owning their homes.
- 94552 (Martinez): Showing a strong 90.6% homeownership rate, with 4,478 out of 4,943 households as homeowners.
- 94517 (Bethel Island): Leading with a high 92.7% homeownership rate, where 4,445 of the 4,797 estimated households are homeowners.
- 95120 (San Jose): Featuring a high 89.6% homeownership rate, with 11,222 out of 12,522 households owning their residences.
Several other zip codes, such as 94708 (Berkeley – Claremont/Elmwood) at 85.2%, 94595 (Moraga) at 84.5%, 95033 (Los Gatos) at 86.2%, 94024 (Los Altos) at 88.7%, and 94957 (Inverness) at 88.8%, also demonstrate robust homeownership.
Interestingly, some zip codes with very few households report 100% homeownership, such as 94720 (Berkeley – Lawrence Berkeley National Laboratory), 94074 (Atherton), and 94512 (Benicia – Arsenal). Similarly, 95607 (Bryte) also shows 100% homeownership among its 167 estimated households.
Areas with Lower Homeownership Rates:
Conversely, numerous zip codes, particularly those in more urbanized areas or near major universities, exhibit significantly lower homeownership rates. These areas often have a higher proportion of renters. Examples include:
- 94704 (Berkeley – Southside/UC Berkeley): With a notably low 11.1% homeownership rate, only 913 of the 8,251 estimated households own their homes.
- 94102 (San Francisco – Tenderloin): Displaying a very low 8.9% homeownership rate, with just 1,598 homeowners out of 18,036 households.
- 94612 (Oakland – Downtown/Jack London Square): Showing a low 8.6% homeownership rate, where only 751 of the 8,750 households are homeowners.
- Other zip codes with lower rates include 94108 (San Francisco – Financial District) at 10.8%, 95134 (San Jose – North San Jose) at 15%, 94304 (Palo Alto – Downtown/University South) at 15.2%, and 94103 (San Francisco – South of Market) at 14.8%.
Significant Household Numbers:
The data also highlights zip codes with a large number of households, indicating denser residential areas. These include:
- 94501 (Antioch): With an estimated 25,452 households.
- 94565 (Pittsburg): With an estimated 28,368 households.
Several San Jose zip codes like 95076 (West San Jose) with 23,856 households, 95035 (Milpitas) with 23,660 households, and 95112 (East San Jose) with 20,879 households also have a substantial number of households.
In San Francisco, zip codes like 94110 (Mission District/Bernal Heights) with 27,504 households and 94122 (Sunset/Parkside) with 22,936 households are among the most populous.


