How Home Prices and Incomes Changed Across 10 Major Florida Cities (2005–2025)
How have home prices and incomes changed in Florida? (2005–2025)
Florida’s housing market didn’t just grow over the past two decades — it changed in ways that fundamentally reshaped affordability. In 2005, many Florida cities were still considered accessible to middle-income households. By 2025, that reality looks very different.
This analysis compares how median home prices and household incomes evolved across 10 major Florida cities — and what that gap means for buyers today.
The Bigger Picture: Prices Outpacing Income Nationwide
The affordability issue in Florida reflects a broader national trend.
Since the early 2000s, U.S. home prices have increased far faster than household incomes. Nationwide, home prices have risen roughly 177%, while incomes grew around 92% over the same period.
Florida stands out even more. Strong population growth, migration, and limited housing supply pushed prices higher than the national average, especially after 2020.
The result: a widening affordability gap across nearly every major Florida city.
10 Major Florida Cities: Then vs Now
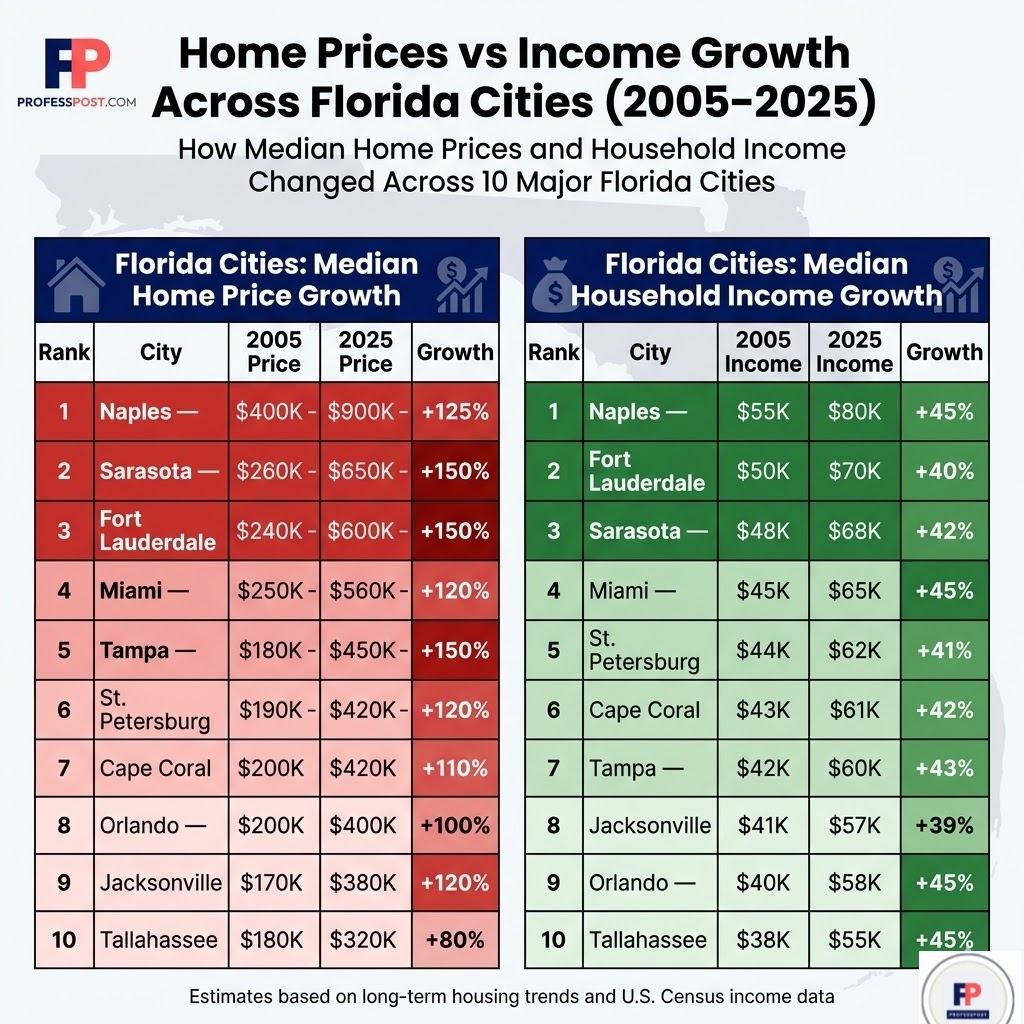
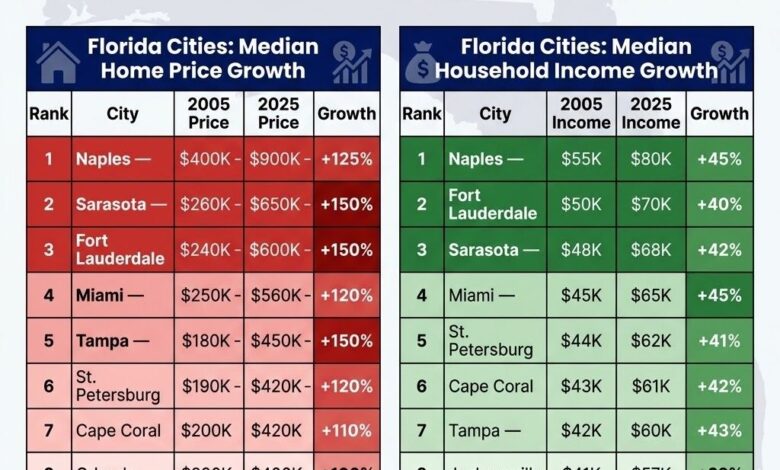
Median Home Prices (2005 → 2025)
- Naples: ~$400K → ~$900K (+125%)
- Sarasota: ~$260K → ~$650K (+150%)
- Fort Lauderdale: ~$240K → ~$600K (+150%)
- Miami: ~$250K → ~$560K (+120%)
- Tampa: ~$180K → ~$450K (+150%)
- St. Petersburg: ~$190K → ~$420K (+120%)
- Cape Coral: ~$200K → ~$420K (+110%)
- Orlando: ~$200K → ~$400K (+100%)
- Jacksonville: ~$170K → ~$380K (+120%)
- Tallahassee: ~$180K → ~$320K (+80%)
Median Household Income (2005 → 2025)
- Naples: ~$55K → ~$80K (+45%)
- Fort Lauderdale: ~$50K → ~$70K (+40%)
- Sarasota: ~$48K → ~$68K (+42%)
- Miami: ~$45K → ~$65K (+45%)
- St. Petersburg: ~$44K → ~$62K (+41%)
- Cape Coral: ~$43K → ~$61K (+42%)
- Tampa: ~$42K → ~$60K (+43%)
- Jacksonville: ~$41K → ~$57K (+39%)
- Orlando: ~$40K → ~$58K (+45%)
- Tallahassee: ~$38K → ~$55K (+45%)
Key insight: In every major Florida city, home prices grew roughly 2–3x faster than incomes.
Why Florida Cities Diverged
While all cities saw rising prices, the reasons vary:
- Miami & Fort Lauderdale: International demand and luxury market expansion pushed prices far above state averages
- Tampa & Sarasota: Pandemic-era migration drove some of the fastest appreciation rates
- Orlando: More balanced growth tied to tourism and job expansion
- Jacksonville: Late-cycle growth as buyers searched for affordability
- Tallahassee: Slower growth due to lower demand and more stable local economy
This shows that Florida is not a single housing market — but a collection of very different local dynamics.
The Hidden Costs: Why Affordability Feels Worse
Rising home prices are only part of the story.
Florida homeowners also face rapidly increasing insurance costs, which add significant pressure to monthly expenses.
👉 See detailed breakdown:
Car Insurance Costs in Florida by City
👉 National comparison:
Home Insurance Burden by City
These additional costs make homeownership more expensive than price data alone suggests.
How This Compares to Other U.S. Cities
Florida’s affordability challenges mirror trends seen in other major markets — but with different drivers.
👉 Compare across major cities:
What $200K Buys in 5 Major Cities
👉 Rent pressure comparison:
Rent-to-Income Ratios
👉 Wealth concentration trends:
Richest Neighborhoods in Florida
Methodology
This analysis combines long-term housing and income trends using multiple datasets:
- Home price estimates based on historical market trends (Zillow, FHFA House Price Index)
- Income data based on U.S. Census Bureau estimates
- City-level comparisons standardized for consistency across time periods
The FHFA House Price Index tracks changes in home values across U.S. states and cities over multiple decades, providing a reliable measure of long-term housing trends.
Income figures are based on Census Bureau estimates of median household income, widely used as a benchmark for affordability analysis.
All values are rounded estimates intended to reflect realistic market ranges rather than exact transaction-level data.
📚 Sources
- U.S. Census Bureau (income data)
- FHFA House Price Index (long-term housing trends)
- Zillow & Redfin market data
- Construction Coverage housing affordability research
- Cotality Florida housing market
Final Takeaway
Florida didn’t just get more expensive — it became fundamentally less affordable.
Across every major city, home prices have pulled away from incomes, creating a gap that continues to shape where — and whether — people can buy.
For buyers in 2026, the question is no longer just “Can you afford a home?”
It’s: Where can your income still keep up?