What It Takes to Be in the Top 10% of Household Wealth in Washington, D.C.

Washington, D.C. has one of the highest concentrations of high-income, highly educated households in the U.S., driven by government, law, consulting, defense, and adjacent tech and policy roles.
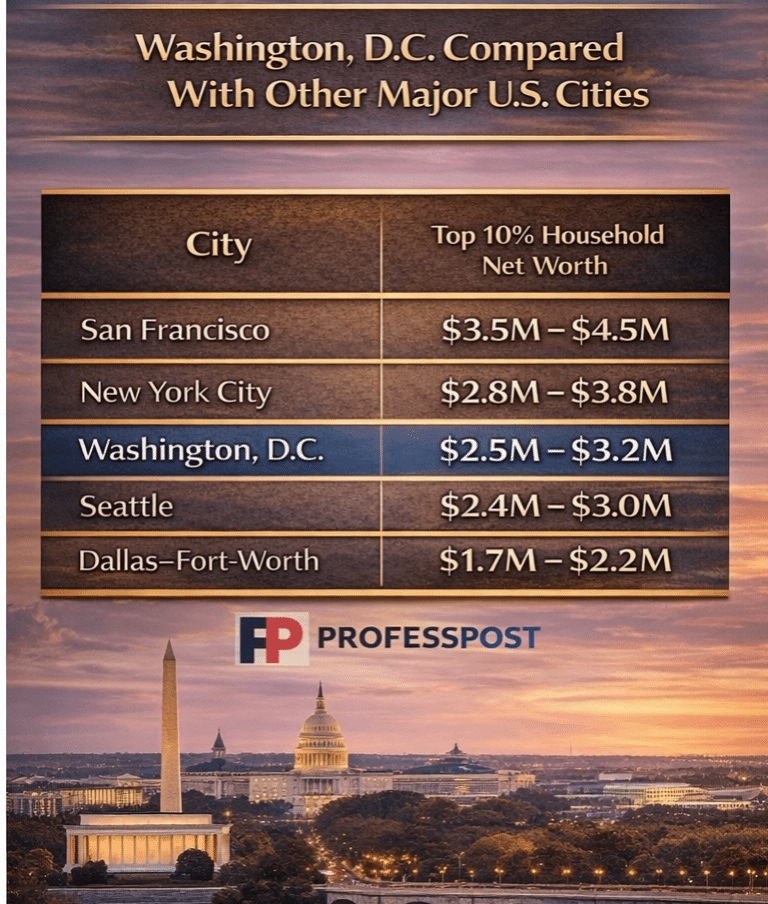
As a result, the wealth threshold to enter the top 10% is higher than in most American metros — but still meaningfully below places like San Francisco or Manhattan.
Unlike cities dominated by equity-heavy tech wealth, D.C.’s upper tier is shaped by stable salaries, pensions, and long-term real estate appreciation.
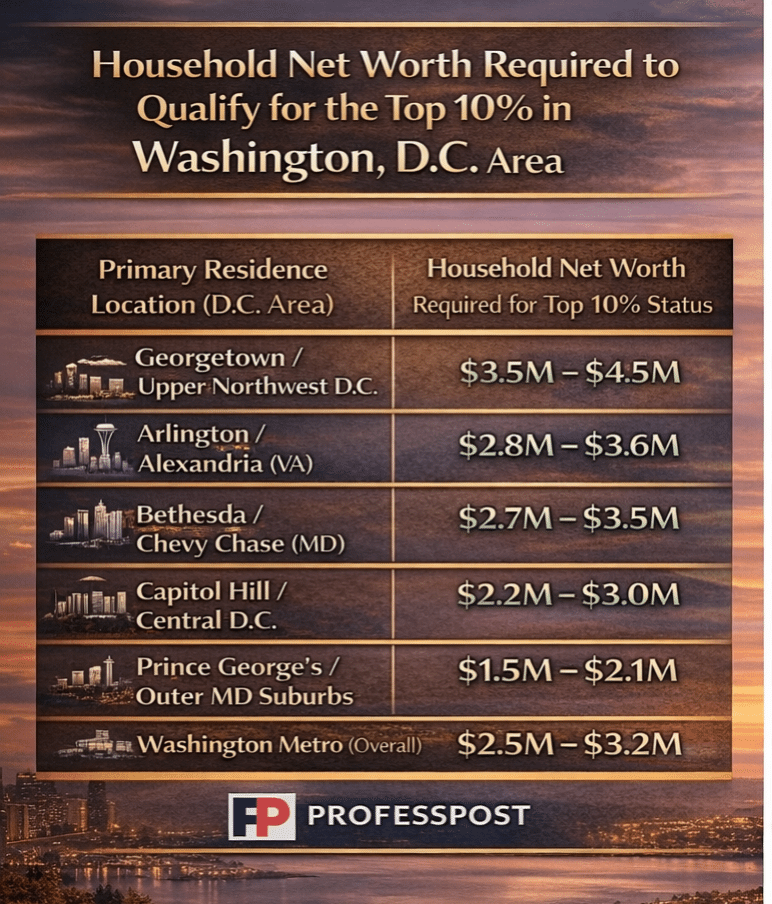
Estimated Top 10% Net Worth Thresholds in the Washington, D.C. Area
Why D.C.’s Wealth Thresholds Look the Way They Do
Washington’s top decile is less about explosive upside and more about compounding stability. Many high–net-worth households reach the top 10% through:
- Dual high-income professional households
- Federal pensions and long-tenure government careers
- Law, consulting, and defense contracting equity
- Decades of home price appreciation in supply-constrained neighborhoods
This creates a wealth profile that is often conservative, diversified, and slower-growing than tech-centric metros — but also more resilient in downturns.
What “Top 10%” Does — and Doesn’t — Mean in Washington, D.C.
Being in the top 10% in D.C. doesn’t automatically imply luxury lifestyles or early retirement. Many households at this level are:
- Equity-heavy in primary residences
- Cash-flow constrained despite high net worth
- Still dependent on employment income
- Sensitive to interest rates and housing cycles
In D.C., wealth often looks comfortable and stable — not flashy.
Washington, D.C. Compared With Other Major U.S. Cities