Year-Over-Year Change in U.S. Home Prices by County (2024–2025)
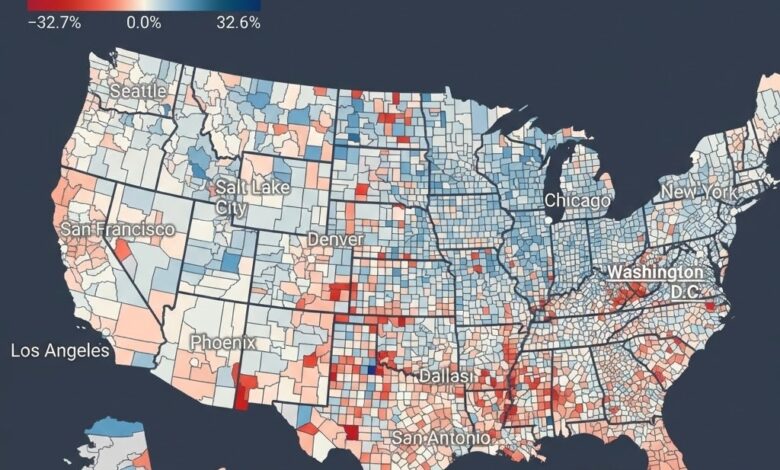
This article presents county-level changes in U.S. home prices between December 2024 and December 2025, based on data from the Zillow Home Value Index (ZHVI).
The analysis covers all U.S. counties and measures the year-over-year percentage change in typical home values.
Overview of County-Level Price Changes
Home price changes varied widely across counties during the period analyzed.
- Some counties recorded price increases exceeding 30%
- Other counties experienced price declines greater than 30%
- A large number of counties showed small changes near zero
The distribution of price changes indicates significant geographic variation in housing market performance.
Counties With the Highest Home Price Increases
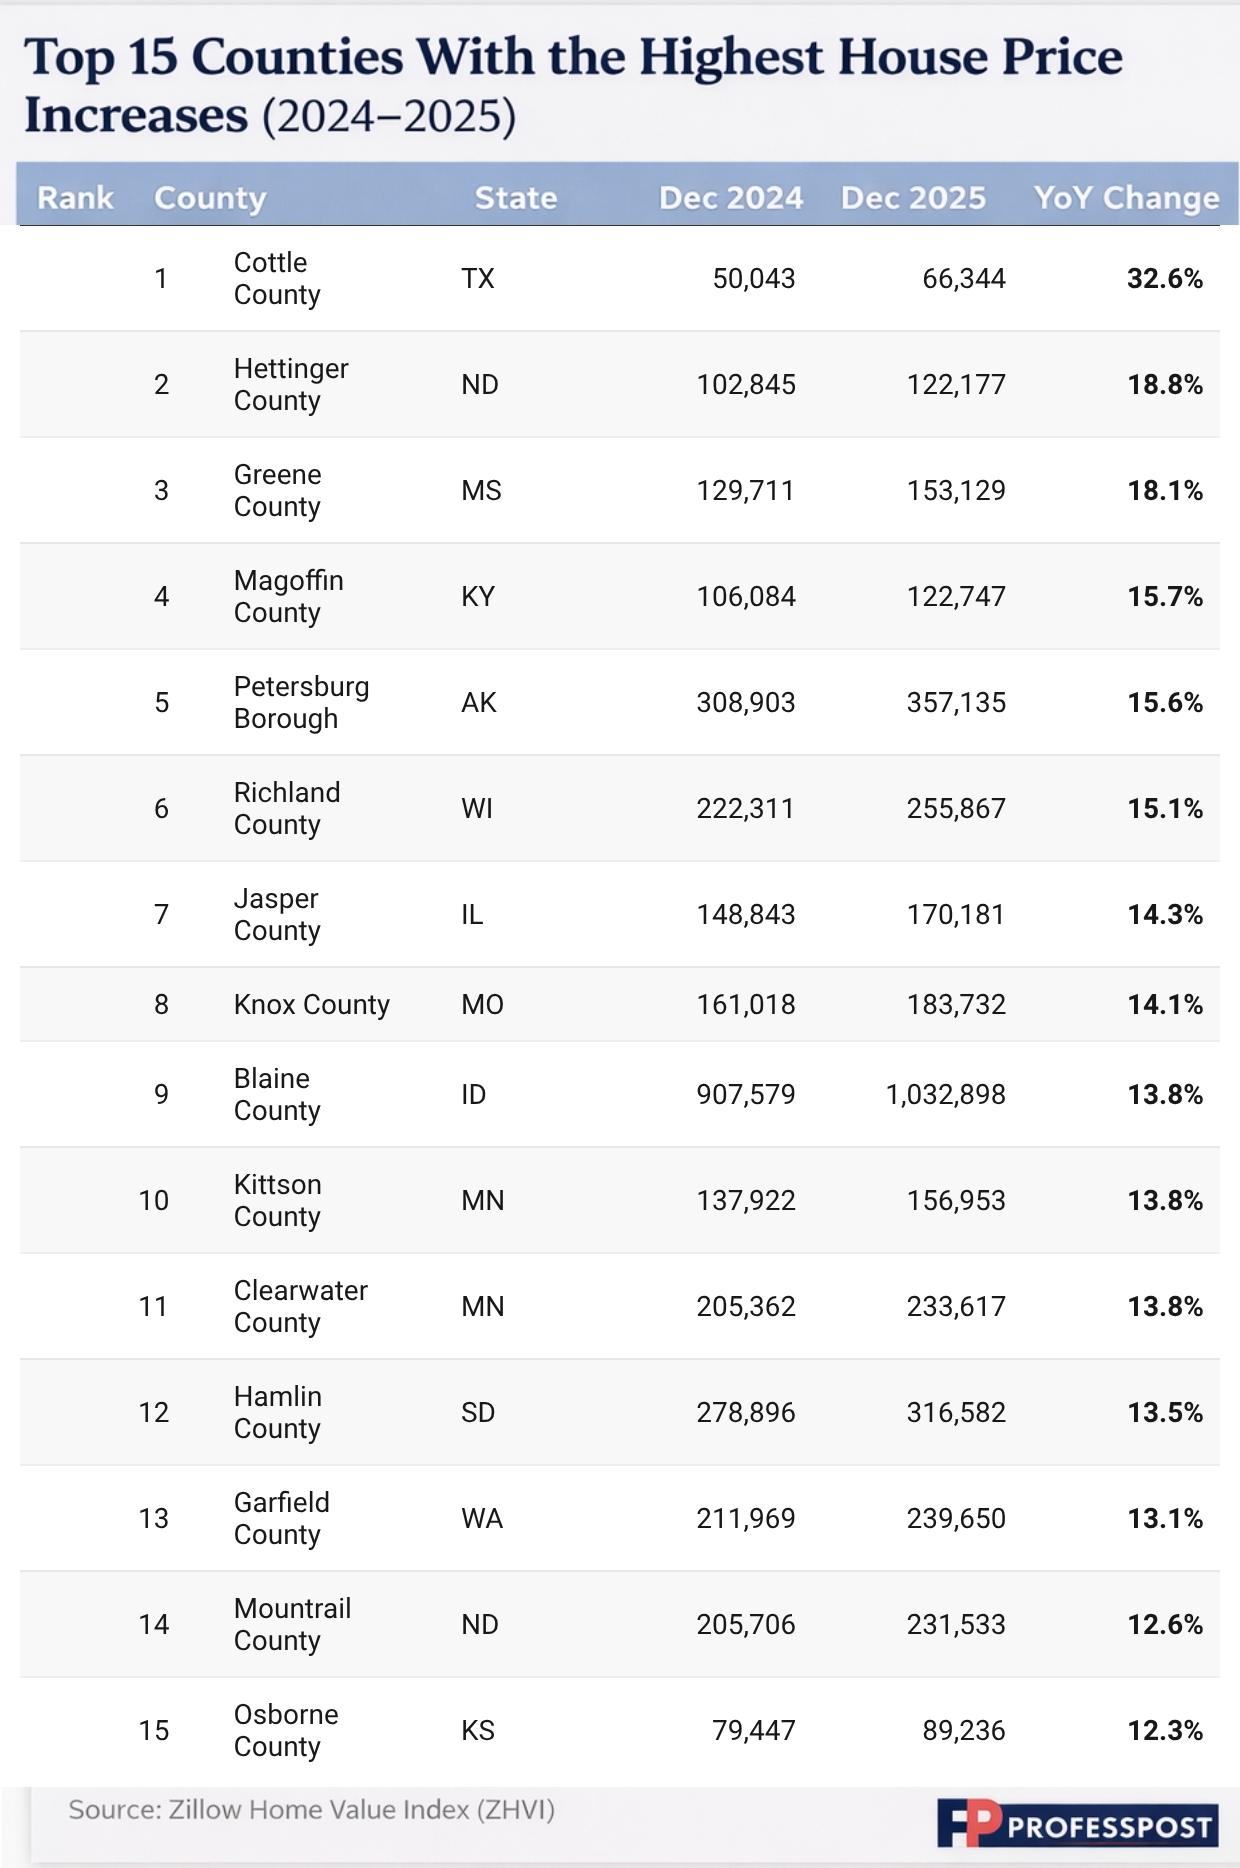
The counties with the largest year-over-year increases generally had lower starting home values. In these counties, relatively small absolute price changes resulted in large percentage increases.
Counties With the Largest Home Price Declines
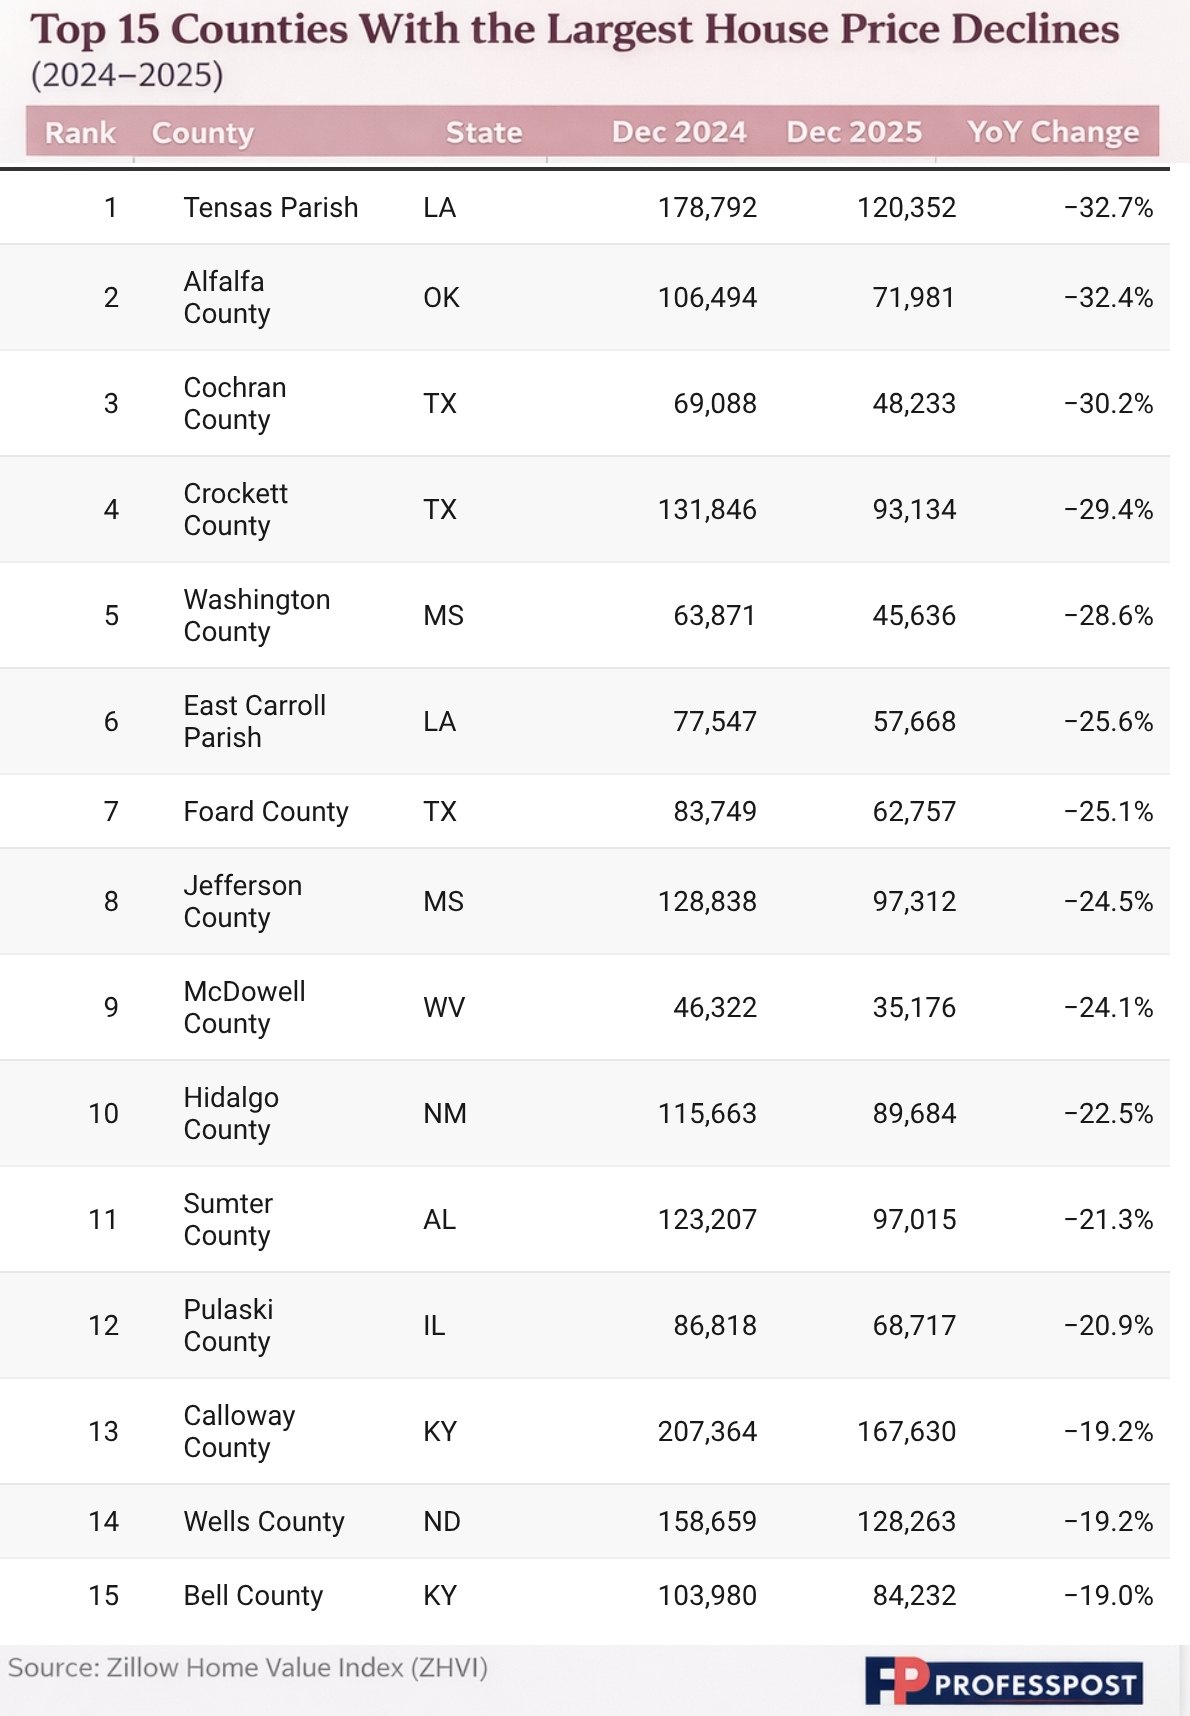
Counties with the largest declines typically experienced reduced demand compared to the prior year. Price decreases were concentrated in a limited number of counties rather than evenly distributed nationwide.
Methodology
- Data source: Zillow Home Value Index (ZHVI)
- Geographic level: County
- Time period: December 2024 to December 2025
- Metric: Year-over-year percentage change in typical home values
- Housing types: Single-family homes and condominiums (middle price tier)
- Geographic matching: County FIPS codes