Dallas–Fort Worth Rent-to-Income Ratio by Neighborhood — Where Housing Feels Affordable
Dallas–Fort Worth is often considered one of the more affordable major metro areas in the United States. But affordability depends on more than rent prices alone. The real question is: how much of your income goes toward rent?
This analysis compares median rent and median household income across key DFW neighborhoods to show where housing costs feel manageable—and where they start to stretch paychecks.
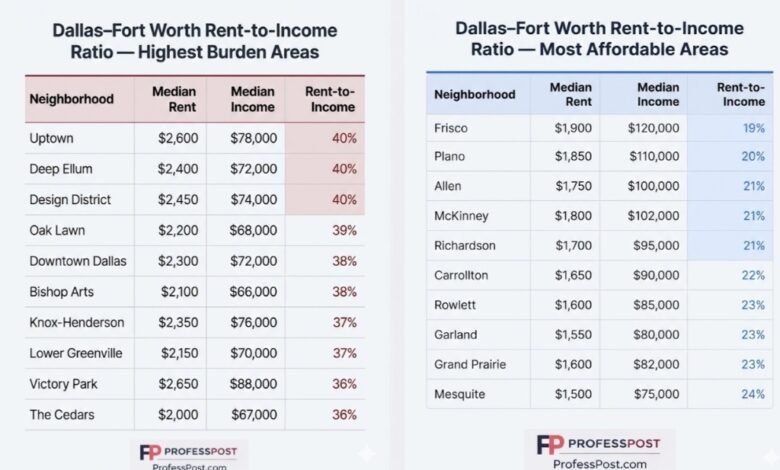
Highest Rent Burden Areas in Dallas–Fort Worth
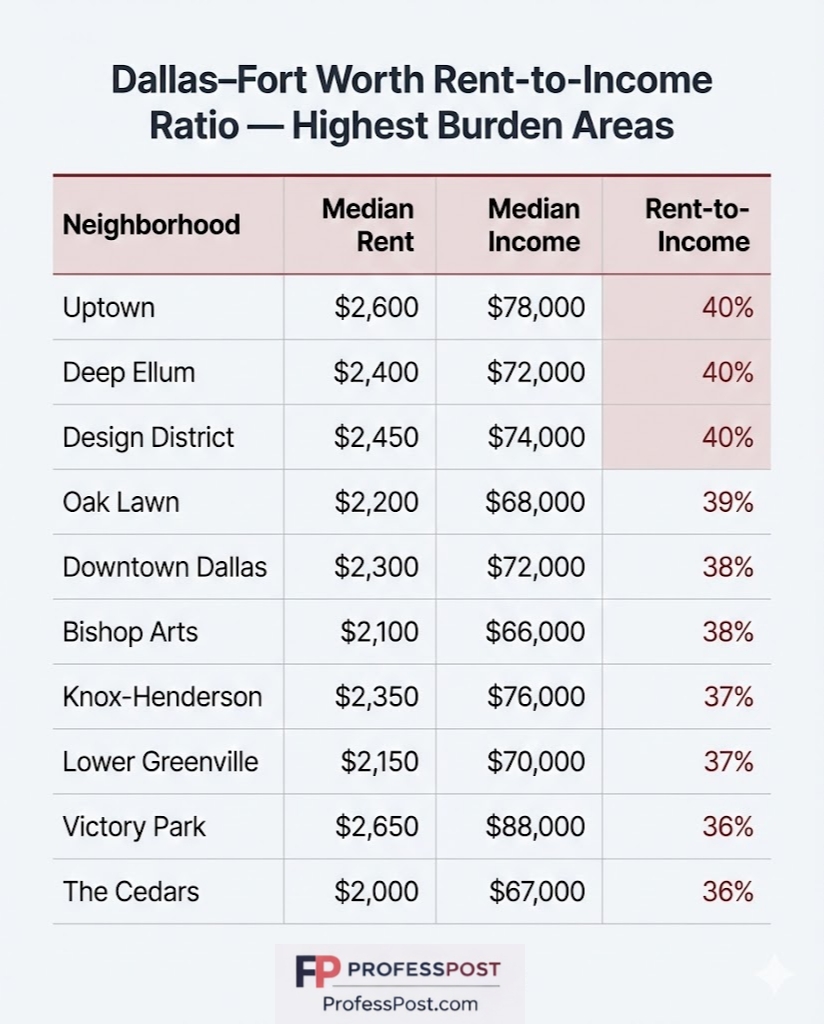
| Neighborhood | Median Rent | Median Income | Rent-to-Income |
|---|---|---|---|
| Uptown | $2,600 | $78,000 | 40% |
| Deep Ellum | $2,400 | $72,000 | 40% |
| Design District | $2,450 | $74,000 | 40% |
| Oak Lawn | $2,200 | $68,000 | 39% |
| Downtown Dallas | $2,300 | $72,000 | 38% |
| Bishop Arts | $2,100 | $66,000 | 38% |
| Knox-Henderson | $2,350 | $76,000 | 37% |
| Lower Greenville | $2,150 | $70,000 | 37% |
| Victory Park | $2,650 | $88,000 | 36% |
| The Cedars | $2,000 | $67,000 | 36% |
In these neighborhoods, housing costs push toward or beyond the commonly recommended 30% affordability threshold. At around 40%, rent begins to significantly limit savings and discretionary spending.
Most Affordable Areas in Dallas–Fort Worth
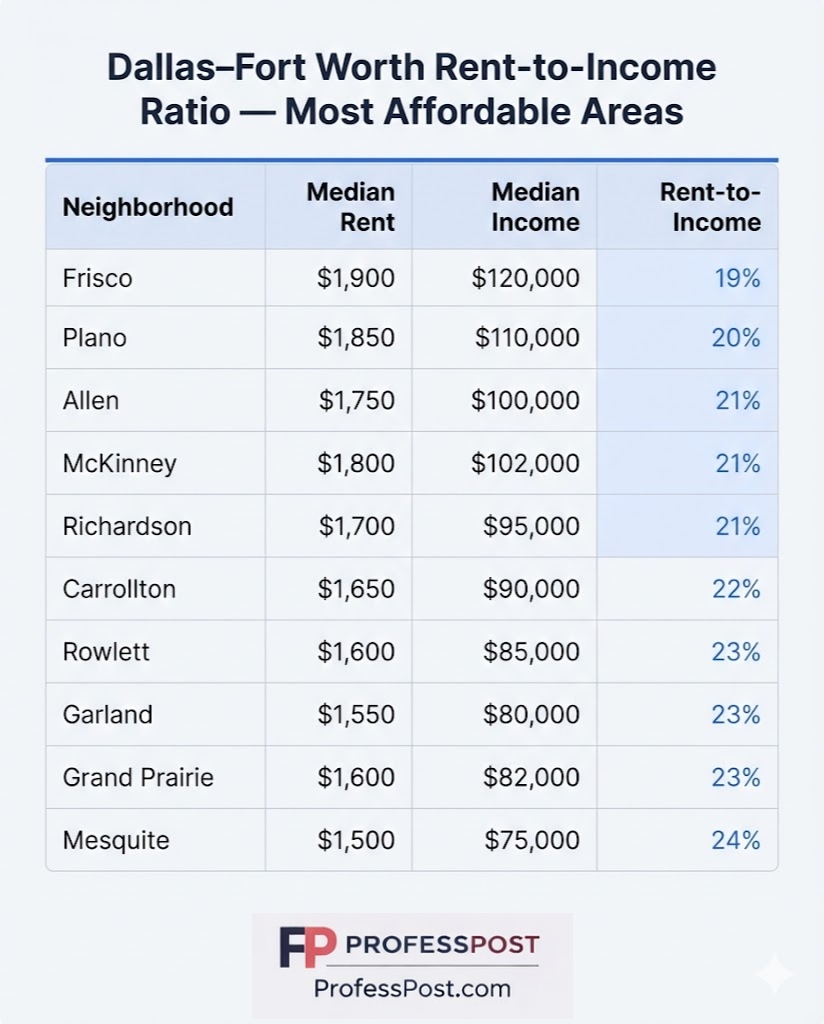
| Neighborhood | Median Rent | Median Income | Rent-to-Income |
|---|---|---|---|
| Frisco | $1,900 | $120,000 | 19% |
| Plano | $1,850 | $110,000 | 20% |
| Allen | $1,750 | $100,000 | 21% |
| McKinney | $1,800 | $102,000 | 21% |
| Richardson | $1,700 | $95,000 | 21% |
| Carrollton | $1,650 | $90,000 | 22% |
| Rowlett | $1,600 | $85,000 | 23% |
| Garland | $1,550 | $80,000 | 23% |
| Grand Prairie | $1,600 | $82,000 | 23% |
| Mesquite | $1,500 | $75,000 | 24% |
These suburban areas show a very different financial reality. With rent-to-income ratios closer to 20–25%, households have more flexibility for saving, investing, and long-term financial stability.
💡 Key Takeaways
- DFW remains more affordable than major coastal cities, but not evenly
- Urban core neighborhoods are approaching 40% rent burden levels
- Suburban areas maintain healthier ratios closer to 20–25%
- Income differences are just as important as rent levels
Nationally, the typical household spends around 30% of income on rent, which is considered the affordability threshold.
🔗 Related Articles
- NYC Rent-to-Income Ratio Analysis
- Richest Neighborhoods in Texas
- Salary Needed to Live Comfortably in Dallas
- Paycheck Power by City
Methodology
This analysis combines publicly available housing and income data to estimate affordability at the neighborhood level.
- Median rent estimates are based on market listings and aggregated rental indices such as Zillow Observed Rent Index (ZORI)
- Median household income is derived from U.S. Census Bureau American Community Survey (ACS) data
- Rent-to-income ratio is calculated as annualized rent divided by annual household income
It is important to note that rental data can vary depending on whether it reflects existing leases or current market listings, which may differ significantly in fast-growing markets.
Sources
- U.S. Census Bureau — American Community Survey
- Zillow Rental Market Data (ZORI)
- Dallas Housing Needs Assessment Report
Recent studies also show that affordability pressures in Dallas are increasing due to demand growth and limited supply, especially for lower-income households.