In Seattle, wealth doesn’t look the way most people expect.
Six-figure salaries are common. Stock compensation inflates incomes on paper. But when you look at actual household net worth, the gap between “doing well” and “top 10%” is far wider than most residents realize.
So what does it really take to rank among the wealthiest 10% of households in the Seattle area?
The Seattle Reality Check
Seattle’s economy creates wealth differently than most U.S. cities. A large share of high-earning households:
- Rely on RSUs and stock grants
- Carry large mortgages
- Are heavily exposed to a single employer or sector
That means income alone is misleading. Balance sheets tell the real story.
The Numbers: Top 10% Net Worth Across the Seattle Area
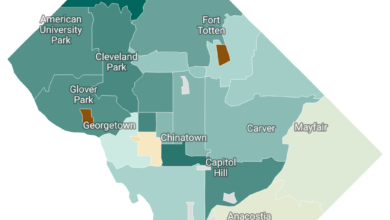
Based on housing values, ownership patterns, and asset concentration, here’s what it typically takes to land in the top 10% of households in different parts of the Seattle region.

Why Seattle’s Threshold Is So High
Seattle’s top 10% cutoff is driven by asset concentration, not lifestyle inflation.Three forces dominate:
- Long-Held Real Estate: Homeowners who bought before the mid-2010s often sit on seven-figure equity gains, even with modest original incomes.
- Stock-Based Wealth: RSUs can dramatically boost net worth — but only if they’re retained, diversified, and not spent.
- Dual Professional Incomes: Many top-10% households rely on two stable, above-average earners rather than one extreme outlier.
What “Top 10%” Does — and Doesn’t — Mean in Seattle
Being in the top 10% in Seattle doesn’t automatically mean early retirement, low financial stress, or a well-diversified portfolio. Many households at this level are asset-rich but cash-light, with most of their net worth tied up in home equity or concentrated tech stock compensation. As a result, wealth in Seattle can grow quickly during strong markets, but it often remains sensitive to housing cycles and market downturns, making it less stable than the headline numbers suggest.
How Seattle Compares to Other Big Cities
Seattle quietly sits closer to San Francisco than Chicago when it comes to wealth thresholds.

What This Means for High Earners in Seattle
If you’re earning well but don’t feel wealthy, this explains why. In Seattle, reaching the top 10% usually requires:
- Time in the market
- Asset appreciation
- Disciplined investing
- Risk management (especially stock concentration)
High income helps — but it’s not the finish line.
Data Sources & Methodology
There is no single public dataset that reports precise household net worth percentiles at the city or neighborhood level. As a result, the estimates in this article are constructed using a multi-source, bottom-up approach designed to reflect realistic wealth thresholds rather than imply false precision. The estimates combine:
- Federal Reserve Survey of Consumer Finances (SCF) for national and regional household net worth distributions
- American Community Survey (ACS) data on homeownership rates and housing characteristics
- Seattle-area residential transaction data to estimate housing equity by location
- Public compensation disclosures and industry surveys to approximate participation in stock-based compensation (RSUs, options)
- Asset ownership patterns observed in high-cost, tech-concentrated metro areas.
Net worth is defined at the household level and includes primary residence equity, retirement accounts, taxable investments, business ownership, and other financial assets, net of liabilities.
Why the Estimates Are Shown as Ranges
In theory, a percentile cutoff (such as the top 10%) is defined by a single threshold. In practice, when estimating wealth at the city and sub-city level, inputs vary meaningfully by data source, timing, and local asset concentration. Rather than present a single point estimate that would overstate confidence, the article reports ranges that reflect this uncertainty across reasonable assumptions.
Being above the upper bound does not imply a ceiling — it simply indicates deeper placement within the top decile.