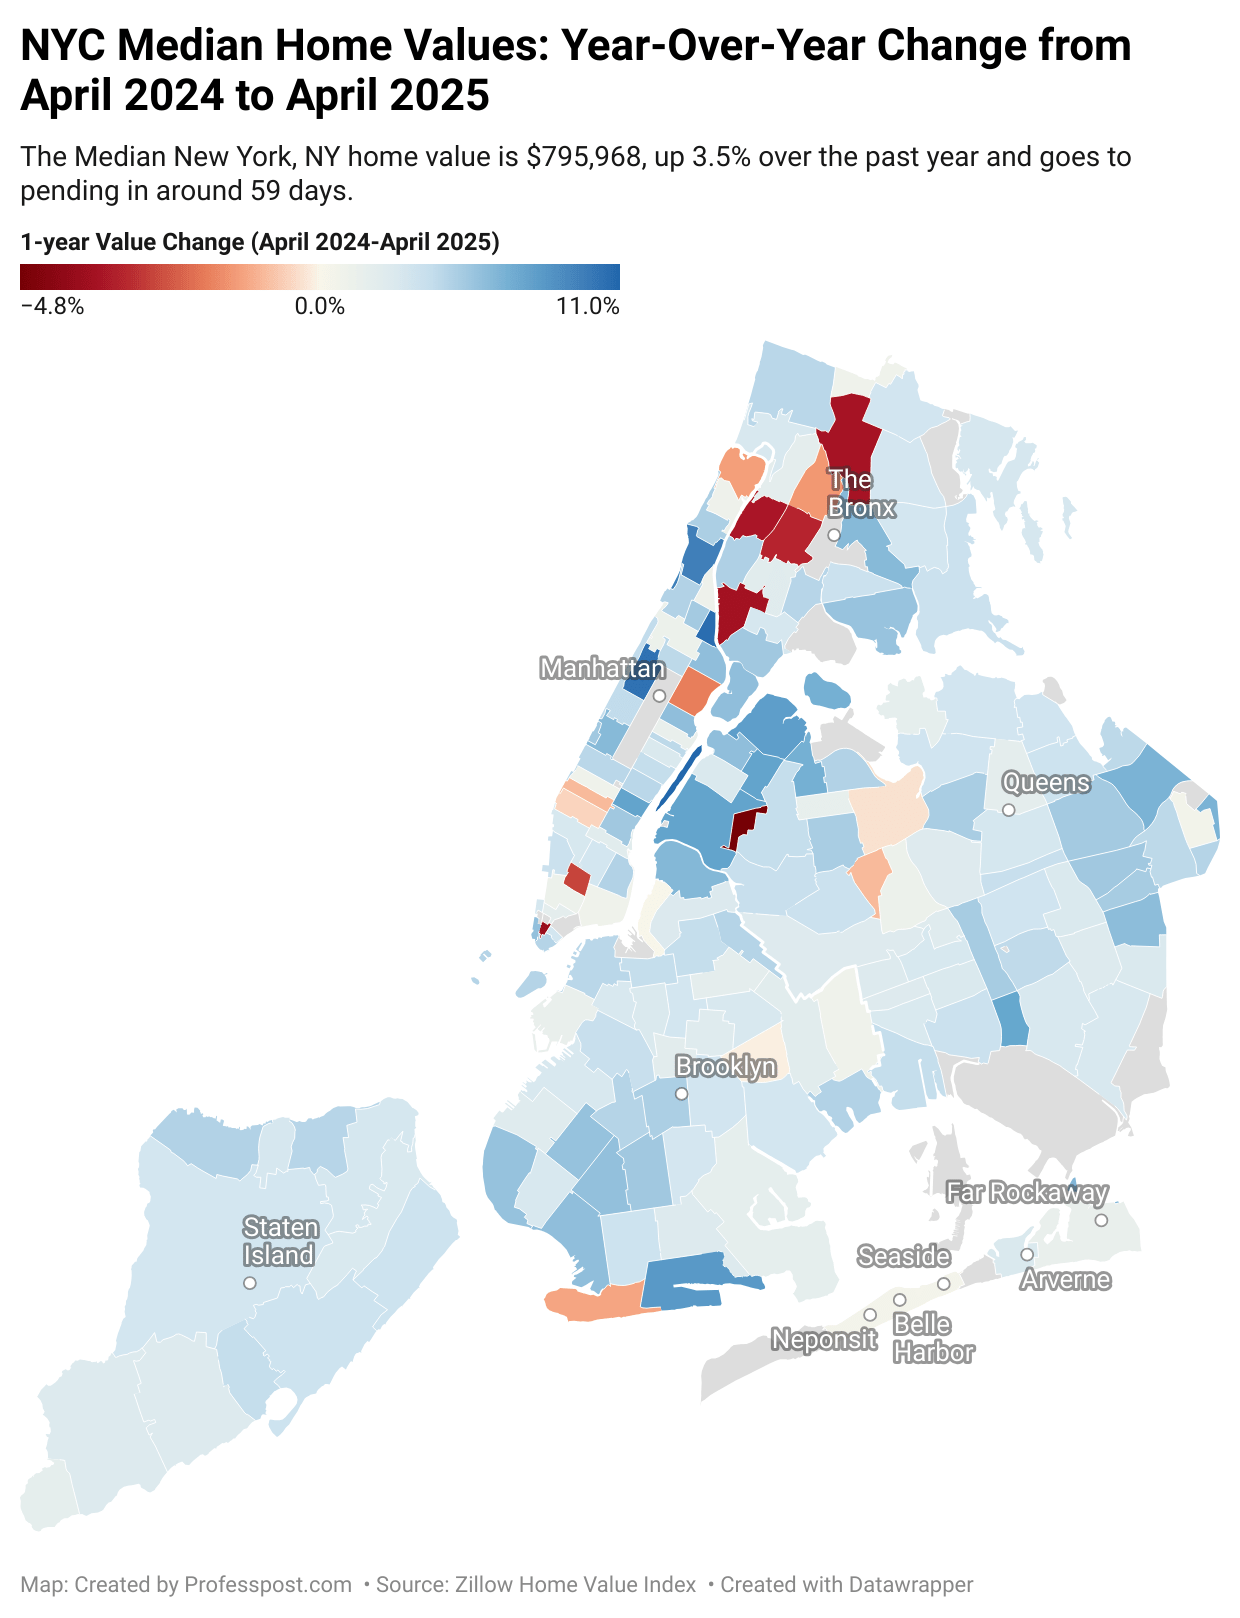
The median home value in New York City, NY is $796,665 — a 3.4% increase over the past year. On average, homes go pending in about 48 days.
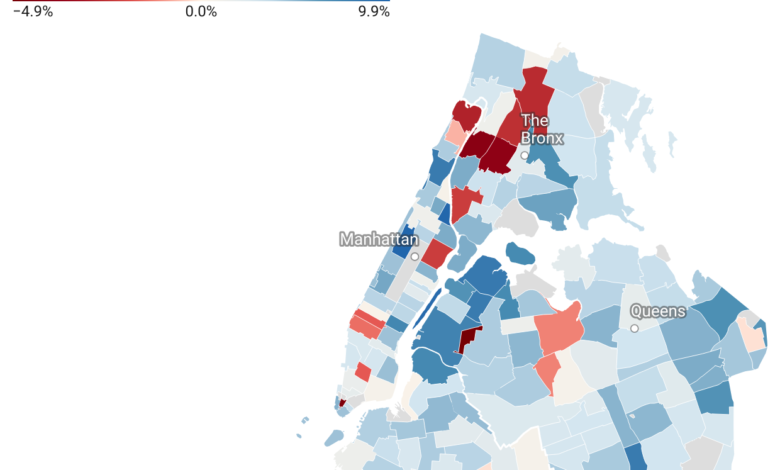
The New York City housing market continued to shift in 2025, with median home values showing a wide range of changes across the city’s ZIP codes. According to the latest data from Zillow for May 2025, the overall NYC median home value stands at $796,665, up 3.4% year-over-year. However, the picture varies dramatically depending on location.
Top Gaining ZIP Codes
Some neighborhoods saw strong growth over the past year. The five ZIP codes with the highest annual price increases were:
- 10025 (Upper West Side) – +9.9%, median value: $1,104,742
- 10037 (Harlem) – +9.9%, median value: $587,839
- 10017 (Midtown East) – +7.1%, median value: $740,876
- 11235 (Brighton Beach) – +7.9%, median value: $597,241
- 11105 (Astoria) – +8.3%, median value: $1,098,023
These gains suggest growing demand in both traditionally popular and emerging neighborhoods, particularly in parts of Queens and Upper Manhattan.
Biggest Declines in Home Value
While many areas posted gains, others experienced notable declines:
- 11104 (Sunnyside) – −4.9%, median value: $499,426
- 10006 (Financial District) – −4.5%, median value: $979,117
- 10453 (Morris Heights) – −4.0%, median value: $570,563
- 10457 (Tremont) – −3.8%, median value: $475,429
- 10034 (Inwood) – −2.8%, median value: $459,118
These decreases may reflect softening investor interest or shifting demand in specific submarkets, particularly in parts of The Bronx and Lower Manhattan.
Million-Dollar ZIP Codes Still Going Strong
NYC still holds many ZIP codes with million-dollar median home values. Among the most expensive in May 2025:
- 10013 (SoHo/Tribeca) – $3,420,498
- 10007 (Tribeca) – $2,995,454
- 10012 (NoHo) – $2,624,078
- 10069 (Riverside Blvd) – $1,893,687
- 11231 (Carroll Gardens) – $1,732,443
Despite their high prices, many of these areas still posted gains between 1% and 5%, signaling continued luxury demand.
Borough-Level Highlights
- Manhattan saw mixed performance. While some high-end areas declined slightly, others like Harlem and Midtown East posted robust gains.
- Brooklyn remained solid overall, with neighborhoods like Brighton Beach, Borough Park, and Bed-Stuy seeing 5%+ appreciation.
- Queens featured rising stars like Astoria and East Elmhurst with strong growth.
- The Bronx was split, with southern and western ZIP codes declining while areas like Soundview and Throgs Neck saw growth.
- Staten Island posted steady increases across most ZIP codes, typically between 3% and 5%.
Affordable Neighborhoods with Strong Appreciation
Several lower-priced ZIP codes across New York City experienced notable increases in home values over the past year, presenting potential opportunities for both buyers and investors. In the Bronx, Parkchester (ZIP code 10462) saw a 6.5% jump, bringing its median home value to $224,307—one of the most affordable in the city. In Queens, East Elmhurst (11370) recorded a 6.8% increase to $801,956, while Little Neck (11362) rose by 6.5% to $659,395. These neighborhoods stand out for combining relative affordability with strong year-over-year growth, making them attractive targets in a shifting market.