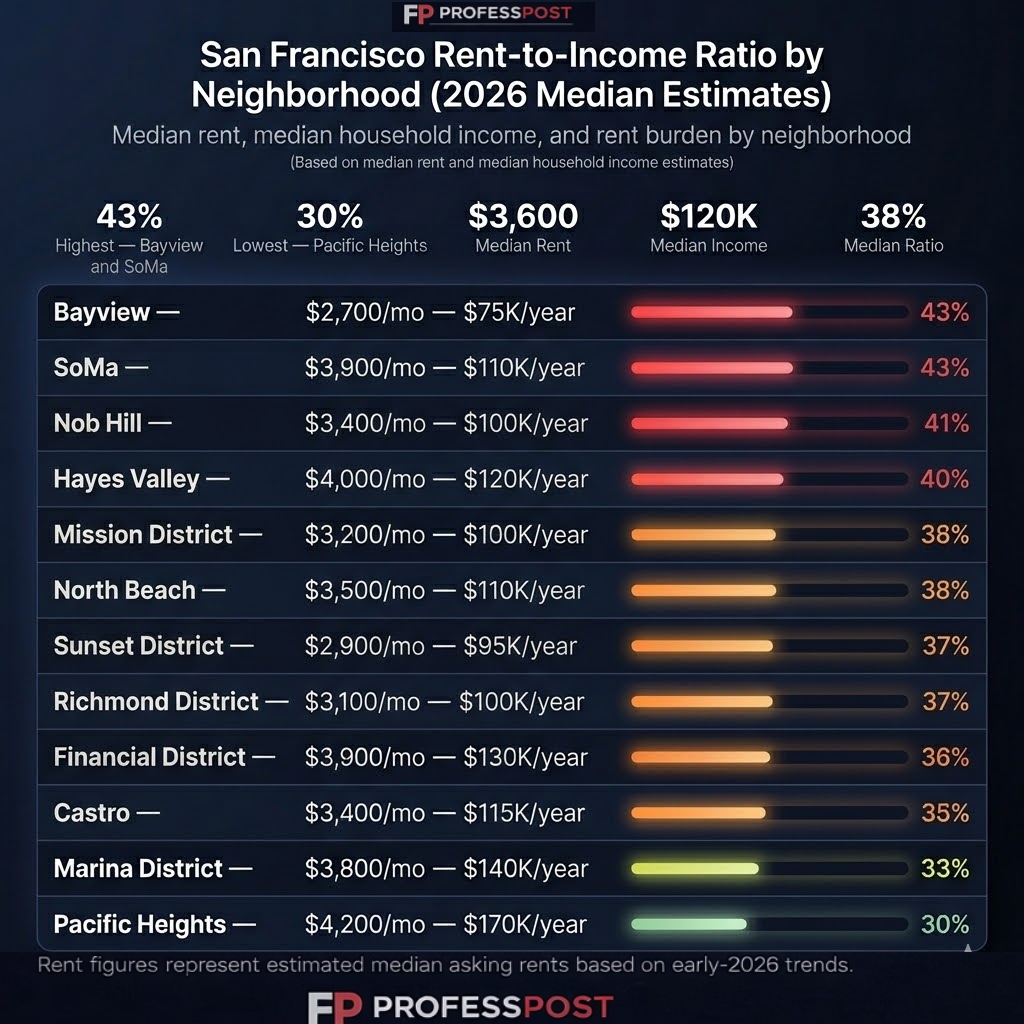
San Francisco Rent-to-Income Ratio by Neighborhood (2026 Median Estimates)
San Francisco remains one of the most expensive rental markets in the United States. In early 2026, affordability continues to decline, with most neighborhoods far exceeding traditional housing cost thresholds.
Using median rent and median household income estimates, this analysis breaks down how much income residents spend on rent across major neighborhoods.
📊 Full Data Table (2026 Median Estimates)
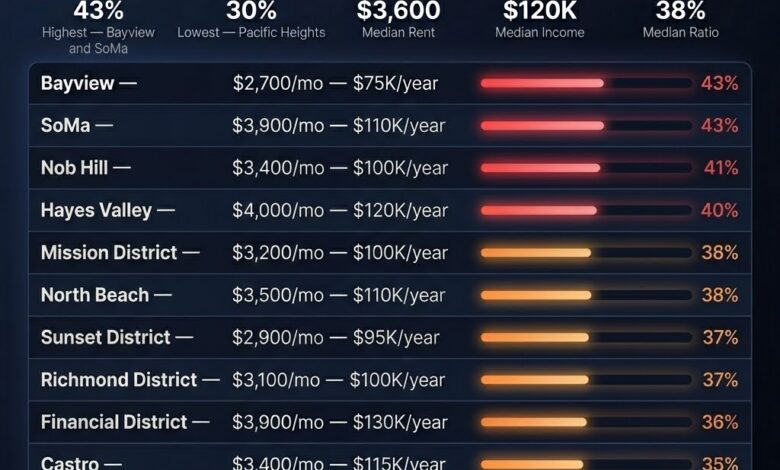
| Neighborhood | Median Rent | Median Income | Rent-to-Income Ratio |
|---|---|---|---|
| Bayview | $2,700 | $75,000 | 43% |
| SoMa | $3,900 | $110,000 | 43% |
| Nob Hill | $3,400 | $100,000 | 41% |
| Hayes Valley | $4,000 | $120,000 | 40% |
| Mission District | $3,200 | $100,000 | 38% |
| North Beach | $3,500 | $110,000 | 38% |
| Sunset District | $2,900 | $95,000 | 37% |
| Richmond District | $3,100 | $100,000 | 37% |
| Financial District | $3,900 | $130,000 | 36% |
| Castro | $3,400 | $115,000 | 35% |
| Marina District | $3,800 | $140,000 | 33% |
| Pacific Heights | $4,200 | $170,000 | 30% |
🚨 Where Rent Hurts the Most
Several neighborhoods stand out for extreme rent burden levels:
- Bayview — 43%
- SoMa — 43%
- Nob Hill — 41%
- Hayes Valley — 40%
These areas combine rising rents with uneven income levels, pushing housing costs close to half of total income.
Even historically wealthy areas like Nob Hill remain among the most expensive real estate markets in the country.
💰 The “Most Affordable” Neighborhoods
While no part of San Francisco is truly cheap, a few neighborhoods appear relatively more affordable:
- Pacific Heights — 30%
- Marina District — 33%
However, this is driven by significantly higher incomes rather than lower rent prices.
In fact, some of San Francisco’s wealthiest neighborhoods see median household incomes exceeding $200,000+
📉 The 30% Rule No Longer Works
The traditional affordability guideline suggests spending no more than 30% of income on housing.
In San Francisco (2026):
- Most neighborhoods exceed 35%
- Several reach 40%+
This suggests that affordability standards have effectively shifted in high-cost cities.
🔗 Related Analyses
Explore similar rent-to-income breakdowns across other U.S. cities:
- Rent-to-Income Ratio in the 30 Largest U.S. Cities
- Dallas-Fort Worth: Where Housing Feels Affordable
- NYC: Where Rent Hurts the Most
- Seattle: Where Housing Costs Hit Hardest
🏆 San Francisco Wealth Insights
For a deeper look at wealth distribution in the city:
San Francisco’s overall median household income is around $128,000+, significantly above the national average.
📊 Methodology
Rent-to-income ratios are calculated using:
Rent-to-Income = (Monthly Rent × 12) ÷ Median Household Income
Rent values are estimated using late-2025 trends, while income figures are based on the latest available datasets.
⚠️ Disclaimer
All figures represent modeled estimates based on recent market data and may vary by unit type, lease terms, and micro-location.
🚀 Final Thoughts
San Francisco’s housing market continues to push affordability limits.
For many residents, the issue is no longer whether the city is expensive — but whether it is financially sustainable long term.


