Top U.S. Cities Ranked by Households Earning $100K+

This article examines household income across America’s 30 largest cities, highlighting how many households earn $100,000 or more and what share they represent of each city.
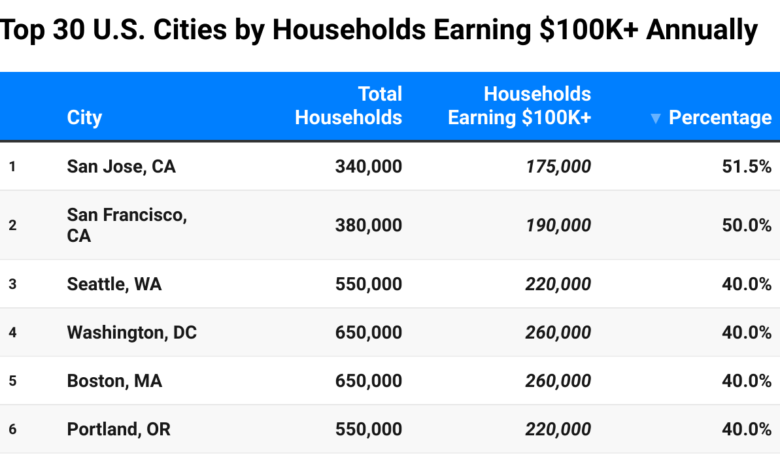
Household income varies widely across the largest U.S. cities, reflecting differences in local economies, industries, and cost of living. The table above summarizes total households, the number of households earning $100,000 or more annually, and the corresponding percentage for each of the 30 largest cities, using data from the U.S. Census Bureau’s 2019–2023 American Community Survey (ACS) 5-Year Estimates.
The data table provides a city-by-city breakdown of household income, showing both absolute numbers and the proportion of high-earning households. This format allows readers to quickly compare cities, identify which metros have the highest concentration of six-figure households, and observe regional economic trends across the country.
Some cities have particularly high concentrations of high-income households. San Jose, CA tops the list, with over 51% of households earning $100K or more, followed closely by San Francisco, CA at 50%. These cities are known for strong technology sectors, high median wages, and a concentration of professional and managerial roles. Other West Coast cities such as Seattle, WA and San Diego, CA also have substantial shares of high-income households, ranging from 39–40%, reflecting the prevalence of tech, healthcare, and business services in these urban economies.
On the East Coast, New York, NY, Boston, MA, and Washington, DC show that even large, diverse cities have a significant share of high-earning households, typically 33–40%. This demonstrates that metropolitan size does not automatically dilute high-income concentration; rather, the mix of industries and economic opportunities plays a key role.
Texas offers an interesting example of regional variation. Cities such as Austin, TX and Houston, TX have 37% and 33% of households earning $100K+, respectively, while San Antonio, TX and Fort Worth, TX are slightly lower, around 28–29%. These differences reflect both local economic conditions and population distribution, including the presence of tech hubs, corporate headquarters, and energy-sector employment.
Some cities have a lower share of high-income households. Detroit, MI and Memphis, TN have only 20% of households earning $100K+, while El Paso, TX and Oklahoma City, OK fall in the 26% range. These figures reflect local industry composition, median wages, and historical economic challenges, which impact overall household income levels.
Across all 30 cities, the data show that high-income households are concentrated not only in traditionally affluent areas but also in fast-growing urban centers with expanding professional sectors. Comparing absolute numbers alongside percentages reveals both population scale and income distribution patterns. For example, New York, NY has the highest number of $100K+ households at over 1 million, while smaller cities like San Jose, CA have fewer households overall but a higher proportion of high earners.


