Where People Actually Own Homes in San Francisco (Neighborhood Breakdown)
San Francisco Neighborhoods Ranked by Homeownership Rate (2026 Breakdown)
San Francisco is often described as a renter’s city—and the data backs that up. But that headline hides a more interesting reality: homeownership isn’t evenly distributed. It’s highly concentrated in specific neighborhoods.
In this breakdown, we go beyond citywide averages and look at where people actually own homes, where they don’t, and why those patterns exist.
For a broader look at affordability across the region, see our comparison of what a $200K salary buys across Bay Area cities.
The Big Picture: San Francisco Is Still a Renter-Dominated City
Before diving into neighborhoods, it’s important to understand the baseline.
- Homeownership rate: ~38%–44%
- Renter share: ~60%+
According to U.S. Census and Federal Reserve data, San Francisco’s homeownership rate sits around 38.5%, far below the national average (~65%).
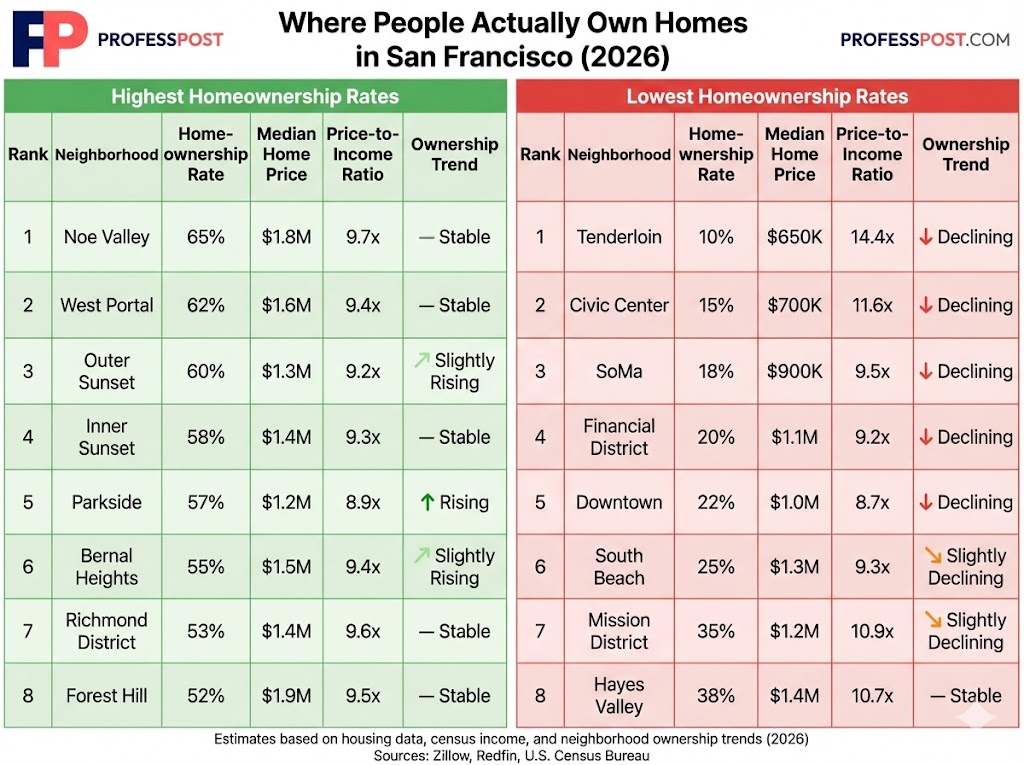
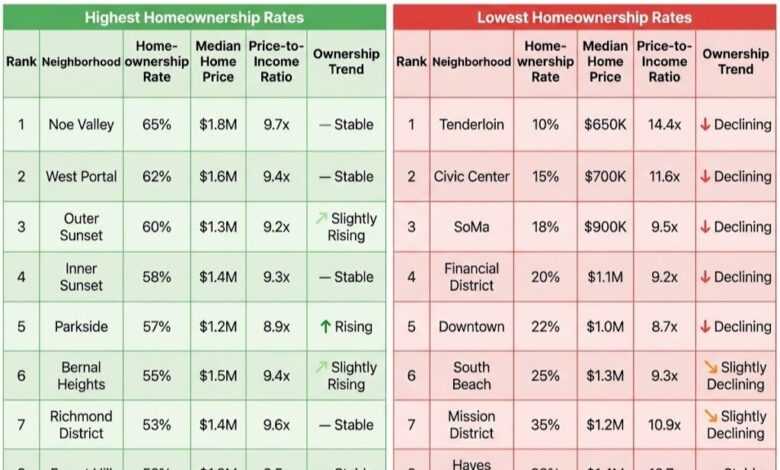
High Homeownership Neighborhoods (50%+)
These are the areas where ownership is still relatively common—and they share a few key traits: family housing, lower density, and extremely high incomes.
- Noe Valley (~65%)
- West Portal (~60%+)
- Outer Sunset (~55–60%)
- Parkside (~55%+)
- Richmond District (~50%+)
💡 Why Ownership Is High Here
1. Housing Type Matters
These neighborhoods are dominated by single-family homes, not high-rise apartments. That alone increases ownership rates.
2. Higher Household Income
Many households earn $150K–$250K+, making it possible to qualify for million-dollar mortgages.
3. Long-Term Stability
Families tend to stay longer, reducing turnover and increasing ownership share.
4. Price-to-Income Ratio (Still High)
Even here, ratios often sit around 8x–10x income, meaning homes cost 8–10 years of household earnings. These are not “affordable” areas—they are simply where ownership is possible.
Mixed Neighborhoods (35–50%)
These neighborhoods represent San Francisco’s transition zones—where ownership and renting coexist.
- Mission District (~35–45%)
- Bernal Heights (~45–50%)
- Inner Richmond (~45%+)
- Hayes Valley (~35–40%)
💡 Why Ownership Is Mixed
1. Gentrification
New buyers are entering, but long-term renters still dominate parts of the housing stock.
2. Mixed Housing Types
You’ll find both condos and older multi-unit rental buildings.
3. Rising Prices
Home prices have increased faster than incomes, pushing ownership rates downward over time.
4. Income Gap
These neighborhoods often have a wide income spread, from lower-income renters to high-income buyers.
Low Homeownership Neighborhoods (Under 30%)
This is where San Francisco’s renter identity is most visible.
- Tenderloin (~10–15%)
- SoMa (~15–25%)
- Financial District (~20%)
- Civic Center (~15%)
- Downtown (~20–25%)
Why Ownership Is So Low
1. High Density Housing
These areas are dominated by apartments and condos, many of which are rented or investor-owned.
2. Younger Population
Neighborhoods like SoMa attract young professionals who are more likely to rent.
3. Income vs Price Mismatch
Even with decent salaries, home prices remain far out of reach.
4. Investor Activity
A significant portion of units are owned as investments, not primary residences.
👉 In some of these neighborhoods, ownership isn’t just low, it’s structurally limited.
Income vs Ownership: The Real Driver
The biggest factor behind homeownership differences is the price-to-income ratio.
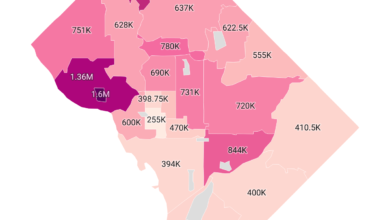
- San Francisco average home value: ~$1.3M+
- Typical household income: ~$120K–$150K
That creates ratios of:
- 8x–10x in higher-income neighborhoods
- 10x–14x+ in lower-income areas
👉 Once that ratio moves above ~8x, ownership rates begin to drop sharply.
This is why even high earners struggle, as explored in our breakdown of income needed to buy a home in San Francisco neighborhoods.
Ownership Trends: What’s Changing?
San Francisco’s homeownership rate has remained relatively flat in recent years, hovering around ~44% or lower.
However, beneath the surface:
- Owner-heavy neighborhoods remain stable
- Urban core areas are becoming more renter-heavy
- New housing is concentrated in rental-heavy districts (SoMa, downtown)
👉 In other words: ownership isn’t spreading, it’s concentrating.
🔗 How This Compares to Other Cities
This pattern isn’t unique to San Francisco, but it’s more extreme here.
For comparison, see how neighborhood-level affordability works in San Diego, where ownership is still more accessible.
🧠 Methodology
This analysis combines multiple data sources to estimate neighborhood-level homeownership patterns:
- U.S. Census Bureau (American Community Survey)
- Federal Reserve Economic Data (FRED)
- Local housing datasets and neighborhood-level estimates
- Zillow and Redfin home value data
Official homeownership rate data sourced from:
Neighborhood-level estimates are derived using:
- Housing type distribution (single-family vs multi-unit)
- Income distribution by area
- Ownership vs rental ratios
All figures are approximate and rounded for clarity.
Final Takeaway
San Francisco isn’t just expensive, it’s structurally divided.
- Ownership is concentrated in a small number of neighborhoods
- Most areas are renter-dominated
- Income alone doesn’t guarantee ownership
👉 The key shift: In San Francisco, where you live determines whether ownership is even possible.