30 Major U.S. Cities Ranked by Home Insurance as a Share of Household Income (2026)
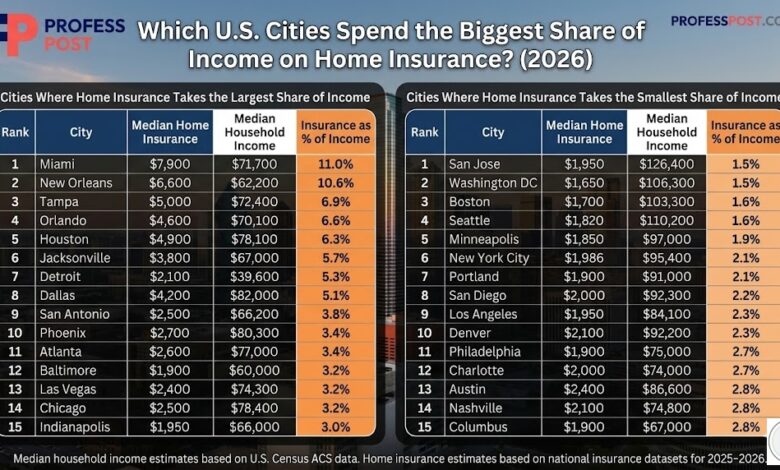
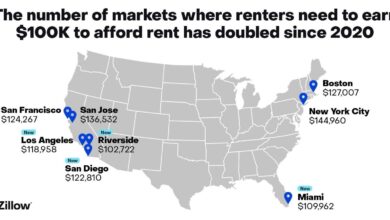
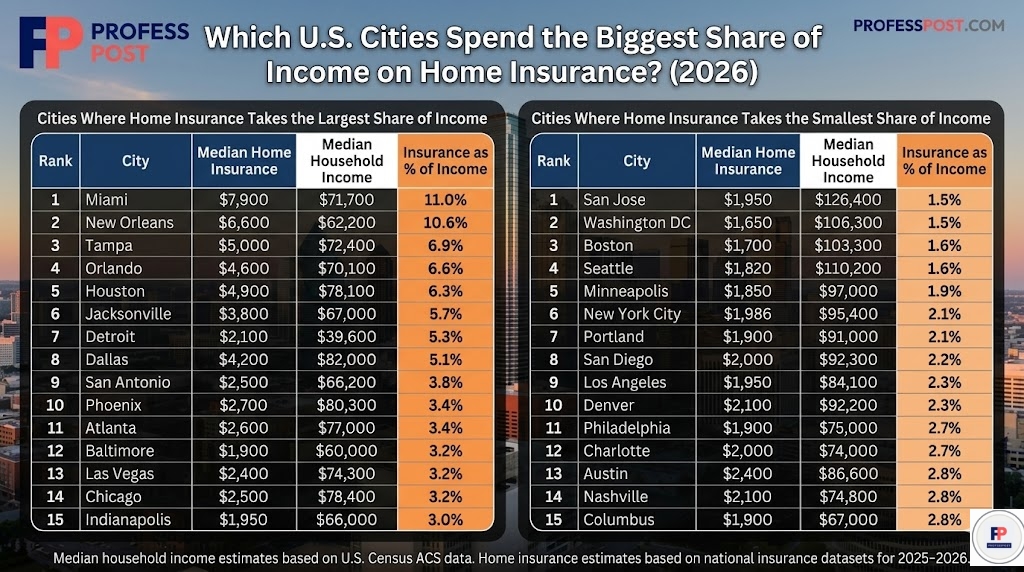
Which U.S. Cities Spend the Biggest Share of Income on Home Insurance? (2026)
Home insurance has quietly become one of the fastest-growing costs of homeownership in the United States. While mortgage payments and property taxes usually get most of the attention, insurance premiums in some cities now consume a surprisingly large share of household income.
In hurricane-prone regions like Florida and Louisiana, homeowners may spend more than 10% of their annual income on home insurance alone. Meanwhile, high-income metro areas such as Seattle or San Jose see much smaller income shares devoted to insurance.
This analysis looks at 30 major U.S. cities and compares median household income with typical annual home insurance costs to determine how much of a household’s income goes toward insurance.
Understanding these ratios provides a clearer picture of housing affordability—similar to how analysts evaluate rent burdens. If you’re interested in rent affordability across major metros, see our breakdown of the
rent-to-income ratio in the 30 largest U.S. cities.
Cities Where Home Insurance Takes the Largest Share of Income
In several southern and coastal metros, insurance premiums are rising rapidly due to climate risk, higher rebuilding costs, and insurers reducing coverage in high-risk areas.
| Rank | City | Median Home Insurance | Median Household Income | Insurance / Income |
|---|---|---|---|---|
| 1 | Miami | $7,900 | $71,700 | 11.0% |
| 2 | New Orleans | $6,600 | $62,200 | 10.6% |
| 3 | Tampa | $5,000 | $72,400 | 6.9% |
| 4 | Orlando | $4,600 | $70,100 | 6.6% |
| 5 | Houston | $4,900 | $78,100 | 6.3% |
| 6 | Jacksonville | $3,800 | $67,000 | 5.7% |
| 7 | Detroit | $2,100 | $39,600 | 5.3% |
| 8 | Dallas | $4,200 | $82,000 | 5.1% |
| 9 | San Antonio | $2,500 | $66,200 | 3.8% |
| 10 | Phoenix | $2,700 | $80,300 | 3.4% |
| 11 | Atlanta | $2,600 | $77,000 | 3.4% |
| 12 | Baltimore | $1,900 | $60,000 | 3.2% |
| 13 | Las Vegas | $2,400 | $74,300 | 3.2% |
| 14 | Chicago | $2,500 | $78,400 | 3.2% |
| 15 | Indianapolis | $1,950 | $66,000 | 3.0% |
Cities Where Home Insurance Takes the Smallest Share of Income
In higher-income metro areas, insurance costs still exist but represent a much smaller portion of household income. In many cases, higher wages offset rising insurance premiums.
| Rank | City | Median Home Insurance | Median Household Income | Insurance / Income |
|---|---|---|---|---|
| 1 | San Jose | $1,950 | $126,400 | 1.5% |
| 2 | Washington DC | $1,650 | $106,300 | 1.5% |
| 3 | Boston | $1,700 | $103,500 | 1.6% |
| 4 | Seattle | $1,820 | $110,200 | 1.6% |
| 5 | Minneapolis | $1,850 | $97,000 | 1.9% |
| 6 | New York City | $1,986 | $95,400 | 2.1% |
| 7 | Portland | $1,900 | $91,000 | 2.1% |
| 8 | San Diego | $2,000 | $92,300 | 2.2% |
| 9 | Los Angeles | $1,950 | $84,100 | 2.3% |
| 10 | Denver | $2,100 | $92,200 | 2.3% |
| 11 | Philadelphia | $1,900 | $75,000 | 2.5% |
| 12 | Charlotte | $2,000 | $74,000 | 2.7% |
| 13 | Austin | $2,400 | $86,600 | 2.8% |
| 14 | Nashville | $2,100 | $74,800 | 2.8% |
| 15 | Columbus | $1,900 | $67,000 | 2.8% |
Why Home Insurance Costs Vary So Much by City
Several factors influence home insurance costs across different metro areas:
- Climate risk: Cities vulnerable to hurricanes, flooding, or severe storms typically have higher insurance premiums.
- Rebuilding costs: Labor and construction costs significantly impact insurance pricing.
- Insurance market conditions: In some states insurers have reduced coverage, driving premiums higher.
- Household income differences: Higher-income cities may appear more affordable because insurance takes up a smaller percentage of income.
Housing Costs Are Only One Piece of the Financial Picture
While home insurance is an important component of housing affordability, it is only one part of a broader financial equation that includes housing costs, salaries, and long-term wealth accumulation.
For example, salaries can stretch very differently depending on the city you live in. Our analysis in
Paycheck Power: What Your Salary Really Feels Like by City
shows how income purchasing power varies dramatically across major metro areas.
Similarly, understanding how income translates into long-term financial security requires looking at wealth data as well. Our guide to
net worth by age in America
breaks down how wealth accumulates across different life stages.
Bottom Line
Home insurance is becoming an increasingly important factor in housing affordability. In some U.S. cities—particularly in hurricane-prone regions—insurance alone can consume a significant portion of household income.
For prospective homeowners, understanding these costs alongside mortgage payments, property taxes, and income levels is essential when evaluating where to buy a home.
As insurance markets evolve and climate risks increase, the share of income devoted to home insurance will likely remain a growing concern for homeowners across the country.
About the Author
Max Forsberg is a housing market and personal finance researcher focused on U.S. real estate affordability, income trends, and household financial data. His work analyzes housing costs, salaries, and wealth patterns across major American cities.
He regularly publishes data-driven insights on housing affordability, income distribution, and cost-of-living trends in the United States. Connect with him on LinkedIn