Greater Seattle Metro Area Rent vs Income by Neighborhood — Where Housing Costs Hit Hardest
The Greater Seattle metro area is one of the most expensive housing markets in the U.S.—but affordability varies more than most people expect. Rather than focusing only on rent prices, this analysis looks at a more meaningful metric: rent-to-income ratio.
By comparing median rent with median household income across Seattle neighborhoods and surrounding cities, we can see where housing costs put the most pressure on residents—and where they remain more balanced.
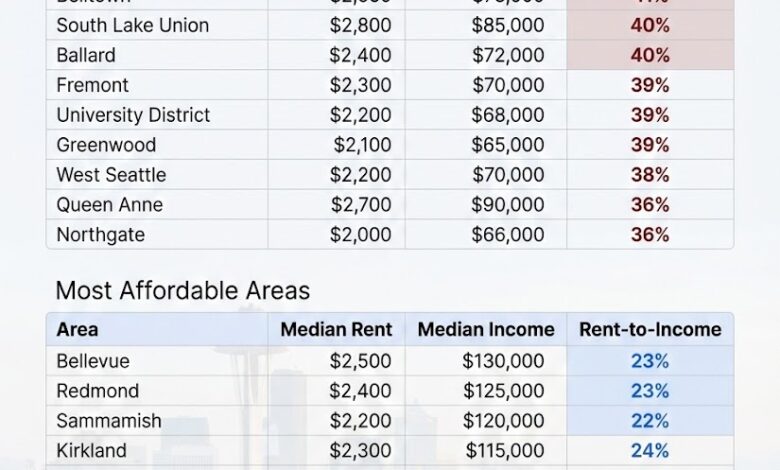
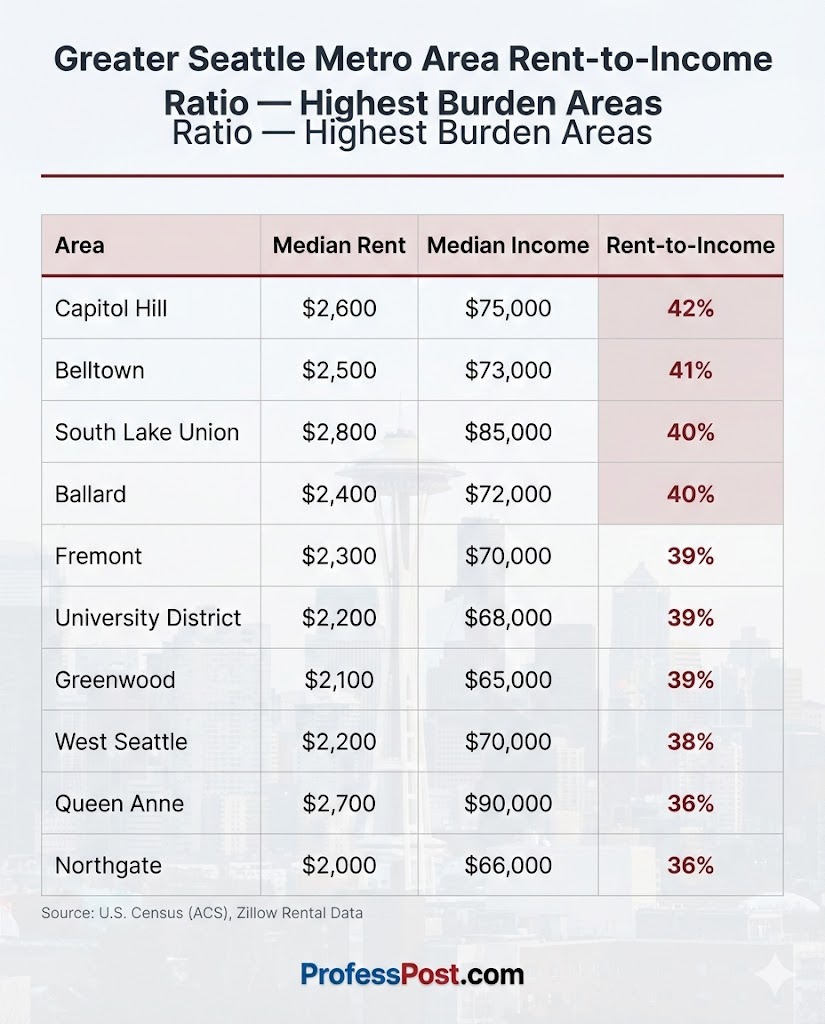
Highest Rent Burden Areas in Greater Seattle
| Area | Median Rent | Median Income | Rent-to-Income |
|---|---|---|---|
| Capitol Hill | $2,600 | $75,000 | 42% |
| Belltown | $2,500 | $73,000 | 41% |
| South Lake Union | $2,800 | $85,000 | 40% |
| Ballard | $2,400 | $72,000 | 40% |
| Fremont | $2,300 | $70,000 | 39% |
| University District | $2,200 | $68,000 | 39% |
| Greenwood | $2,100 | $65,000 | 39% |
| West Seattle | $2,200 | $70,000 | 38% |
| Queen Anne | $2,700 | $90,000 | 36% |
| Northgate | $2,000 | $66,000 | 36% |
In these areas, rent often takes up 40% or more of household income—well above the commonly accepted affordability threshold of 30%.
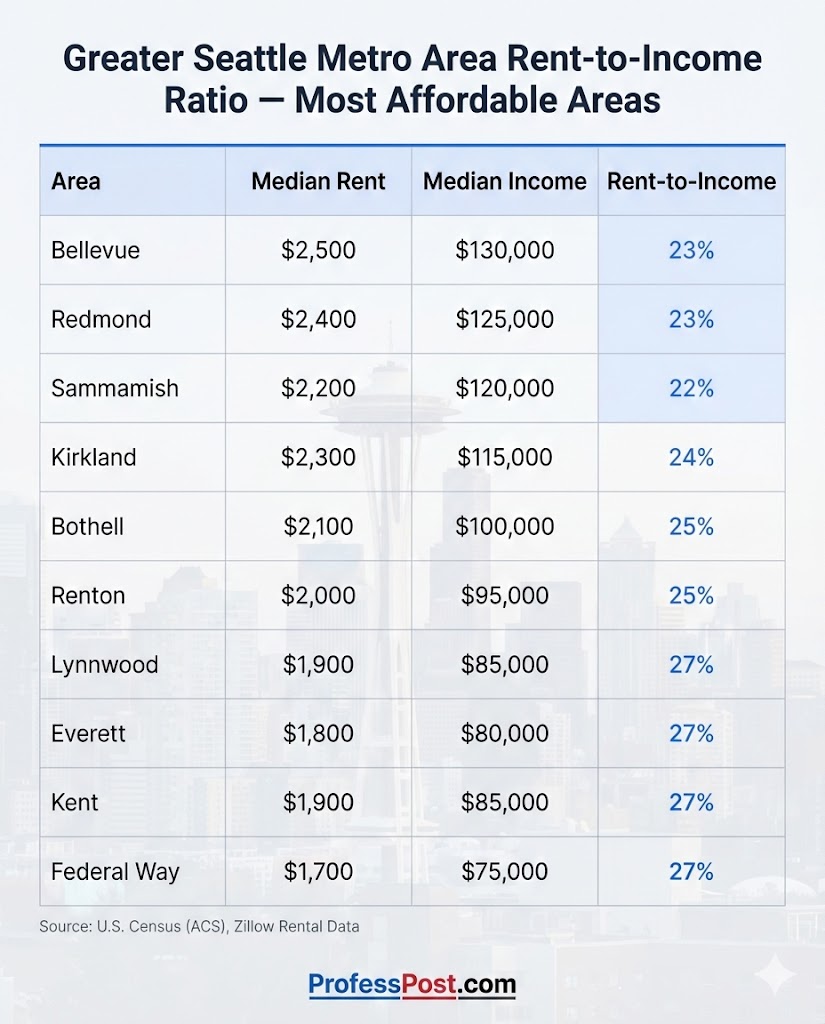
More Affordable Areas Across the Seattle Metro Area
| Area | Median Rent | Median Income | Rent-to-Income |
|---|---|---|---|
| Bellevue | $2,500 | $130,000 | 23% |
| Redmond | $2,400 | $125,000 | 23% |
| Sammamish | $2,200 | $120,000 | 22% |
| Kirkland | $2,300 | $115,000 | 24% |
| Bothell | $2,100 | $100,000 | 25% |
| Renton | $2,000 | $95,000 | 25% |
| Lynnwood | $1,900 | $85,000 | 27% |
| Everett | $1,800 | $80,000 | 27% |
| Kent | $1,900 | $85,000 | 27% |
| Federal Way | $1,700 | $75,000 | 27% |
These areas benefit from higher household incomes, especially in tech-driven suburbs, keeping rent burdens closer to sustainable levels.
💡 Key Takeaways
- Seattle’s urban core shows rent burdens above 40%
- Suburban areas offer better income-to-rent balance
- High salaries help offset high rents—but not everywhere
- The metro area shows large affordability gaps within short distances
Want a deeper look at what income actually feels comfortable in this market? See our full breakdown here:
What Income Actually Feels Comfortable in Seattle.
🔗 Related Articles
- NYC Rent-to-Income Breakdown
- Richest Neighborhoods in Texas
- Salary Needed in Dallas
- Paycheck Power by City
Methodology
This analysis combines rental market estimates with publicly available income data.
- Median rent is based on aggregated rental listings and market indices
- Median household income is derived from U.S. Census Bureau (ACS)
- Rent-to-income ratio is calculated as annual rent divided by annual income
Figures are estimates and may vary based on lease timing and market conditions.
📚 Sources
- U.S. Census Bureau — American Community Survey
- Zillow Rental Market Data
- Seattle Housing Market Reports