Denver’s rapid growth over the past decade has quietly reshaped what “wealthy” means in the Mile High City. Rising home values, tech hiring, and equity compensation have pushed net worth thresholds higher — especially for homeowners in high-demand neighborhoods and suburbs.
But unlike coastal metros, Denver’s wealth profile is more evenly distributed, with housing playing a larger role than inherited assets or ultra-high salaries.
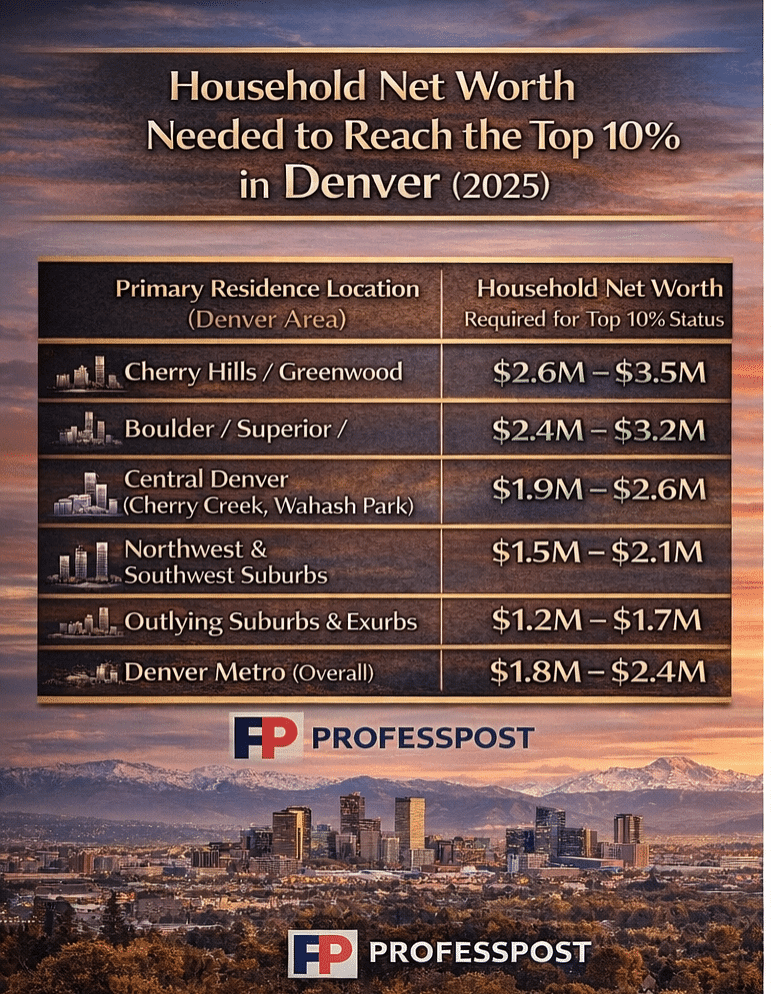
Below is an estimate of how much household net worth is typically required to rank in the top 10% across different parts of the Denver area.
Estimated Top 10% Net Worth Thresholds by Area (Denver Metro)
Why Denver’s Top 10% Looks Different Than Coastal Cities
In cities like San Francisco or New York, top-decile wealth is often driven by concentrated equity events or long-held family assets. Denver, by contrast, leans heavily on:
- Primary residence appreciation
- Dual-income professional households
- 401(k) and brokerage accumulation
- Moderate exposure to tech and startup equity
As a result, many households cross into the top 10% gradually — often without feeling “rich” in day-to-day life.
Being in the Top 10% Doesn’t Mean You’re Financially Set
Reaching the top decile in Denver doesn’t automatically translate to financial freedom. Many households at this level are:
- Highly exposed to real estate values
- Carrying large mortgages relative to income
- Dependent on market performance for retirement timing
In other words, wealth may look strong on paper, but liquidity and flexibility can still be limited.
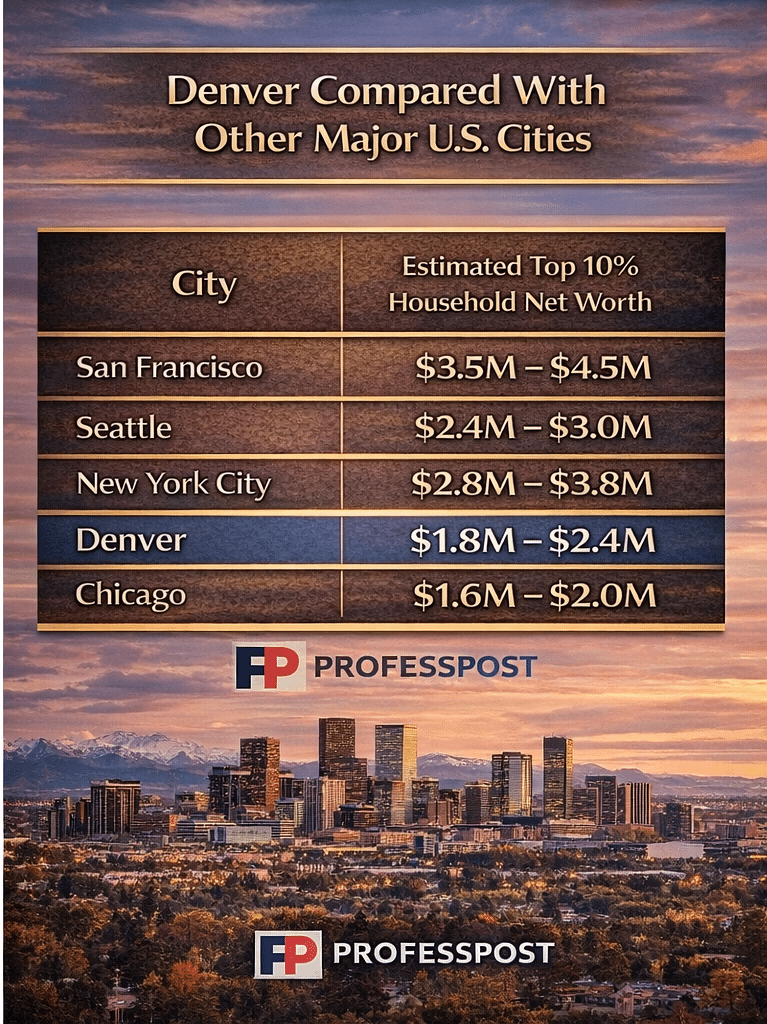
How Denver Compares to Other Major U.S. Cities