New York City has one of the widest wealth gaps in the United States. A net worth that would put you firmly in the top tier nationally may barely register as “upper-middle class” in some NYC neighborhoods.
So what does it actually take to reach the top 10% of households in New York City — and how much does that number change depending on the borough you live in? The answer varies far more than most people expect.
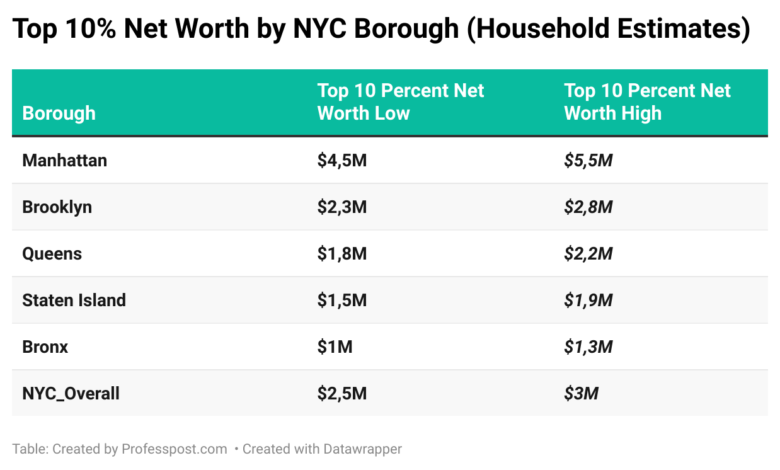
Top 10% Net Worth by NYC Borough (Household Estimates)
Across all five boroughs combined, a household typically needs around $2.5 million to $3.0 million in net worth to land in NYC’s top 10%. That’s roughly double the national threshold. But that citywide average hides huge borough-level differences.
Manhattan: Where the Bar Is the Highest
In Manhattan, the top 10% threshold rises to roughly $4.5 million to $5.5 million. This isn’t just about high incomes. Much of Manhattan’s wealth comes from: Long-held real estate with massive appreciation, Investment portfolios built over decades and Business ownership and inherited assets.
A household earning a high six-figure salary but renting or carrying a large mortgage can still fall well short of the borough’s top decile. In practical terms, $3 million in Manhattan often means “comfortable,” not wealthy.
Brooklyn: Rapidly Catching Up
Brooklyn’s top 10% cutoff sits around $2.3 million to $2.8 million, a number that has climbed sharply over the past decade. Much of this growth is driven by:
- Gentrification in neighborhoods like Park Slope, Williamsburg, and Brooklyn Heights
- Long-time homeowners benefiting from rising property values
- Dual-income professional households
In many parts of Brooklyn, reaching the top 10% now requires wealth comparable to that of entire U.S. metro areas.
Queens: Strong Wealth, Lower Threshold
Queens has a more diverse housing stock and income mix, which keeps the top-10% threshold lower — roughly $1.8 million to $2.2 million. Here, many top-decile households are: Homeowners with substantial equity, Small business owners and Professionals with steady but not extreme incomes. Queens demonstrates how homeownership alone can push households into the upper tier without the ultra-high salaries seen in Manhattan.
Staten Island: Traditional Wealth Patterns
In Staten Island, the top 10% threshold ranges from $1.5 million to $1.9 million. Housing costs are lower, but:
- Owner occupancy rates are high
- Mortgages tend to be smaller
- Net worth builds steadily over time
This creates a borough where wealth accumulation looks more like suburban America — slower, but still well above national averages.
The Bronx: Lowest Threshold, Still High Nationally
The Bronx has the lowest top-10% cutoff, estimated at $1.0 million to $1.3 million. Even so, that level of wealth still places a household: Far above the U.S. median net worth, and Ahead of most American cities’ middle-class benchmarks.
The Bronx highlights how relative wealth is highly local — what qualifies as elite in one borough can be closer to average in another.
NYC vs the Rest of America
For context:
- U.S. top 10% net worth: ~$1.3M–$1.5M
- NYC overall: ~$2.5M–$3.0M
- Manhattan alone: ~$5M+
This explains why many New Yorkers earning $250,000–$400,000 still don’t feel wealthy. Income may be high, but net worth — especially housing — is what determines class position in NYC.
Income vs Net Worth: Why High Earners Miss the Cut
A common misconception is that a high salary automatically means top-tier wealth. In NYC:
- Renters with high incomes often have limited net worth
- Heavy taxes and housing costs slow wealth accumulation
- Home equity plays an outsized role in rankings
That’s why two households earning the same income can sit in completely different wealth percentiles depending on when and where they bought property.