How Much You Need to Earn to Join the Top 0.1% in Every U.S. State

How Much You Need to Earn to Join the Top 0.1% in Every U.S. State (2025 Data)
For years, “the one percent” has been shorthand for the economic elite, but the top 0.1% is an even more exclusive club — the wealthiest one-thousandth of Americans. Their incomes aren’t just high; they’re in a completely different league. In 2025, joining this tier in some states means bringing in over $5 million per year, while in others it’s still well into the seven figures.
We set out to answer a deceptively simple question: How much do you need to earn to join the top 0.1% in each U.S. state? The answer, as it turns out, depends heavily on where you live and the industries that dominate your state’s economy.
America’s Income Elite
The top 0.1% represents households whose earnings place them far above even the top 1%. Statistically, the gap between the 1% and 0.1% is massive. While the top 1% threshold in the U.S. often sits in the mid-six figures, the 0.1% can require three to four times that amount. This is partly due to the Pareto distribution of income, where the very highest earners are disproportionately far ahead of the rest.
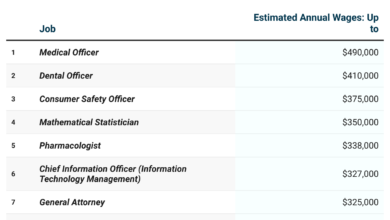
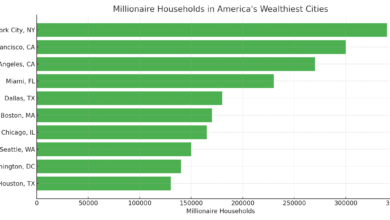
States with thriving finance, tech, and legal sectors — like Connecticut, California, and New York — tend to have much higher thresholds. Meanwhile, states with lower costs of living, such as West Virginia or Mississippi, still require millions to enter the 0.1%, but the number is significantly lower.
How Did We Get This Information?
These figures are not pulled from thin air — they’re calculated using publicly available data and established statistical methods. We started with 2021 IRS Statistics of Income and Economic Policy Institute (EPI) data on the top 1% income thresholds for each state. From there, we applied a Pareto distribution tail factor (around 3.6×) to estimate the 0.1% threshold. This factor comes from the mathematical relationship between top income brackets in a heavy-tailed distribution.
Next, we adjusted all numbers for inflation from 2021 to 2025 using Bureau of Labor Statistics CPI-U data, which adds roughly 17% to account for price increases over that period. The result is an informed, inflation-adjusted estimate of the income you’d need in 2025 to join the financial elite in each state.
Estimated 2025 Top 0.1% Income Thresholds by State
Note: These are estimates intended for educational and informational purposes. Real thresholds can vary year to year based on economic conditions and income reporting.
Why It Matters
These thresholds aren’t just numbers; they tell a story about economic disparity, opportunity, and the industries shaping each state’s wealthiest households. Whether you’re aiming to join this elite tier, studying inequality, or simply curious about where your state stands, the data offers a revealing snapshot of America’s wealth distribution in 2025.