U.S. Metro Areas Face Rising Prices: Which Cities Are Hit Hardest?

Inflation in the United States has seen a significant drop from its peak, declining from a staggering 9.1% annual rate in June 2022 to just 2.5% in August 2024. However, despite this progress, consumer prices remain high and are expected to stay elevated unless a recession occurs.
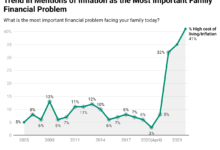
In August 2024, consumer prices were, on average, 22.0% higher than in January 2020, before the COVID-19 pandemic disrupted the U.S. economy and daily life. A recent survey reveals that 74% of Americans are deeply concerned about rising food and consumer goods prices, while 69% are equally worried about escalating housing costs.
Inflation affects people differently based on where they live and what they purchase. While the national average inflation rate provides a general measure, the real impact varies by location and spending habits. For example, the price of apartments in Atlanta, bananas in Boston, or sportswear in Seattle can differ significantly, creating unique inflation experiences for individuals. Understanding these local differences is key to grasping the true effects of inflation.
Inflation vs. Prices: Understanding the Difference
Inflation and the prices of goods and services are often mistaken as the same thing. In reality, the inflation rate measures how much prices have increased over a specific period, such as a month or a year. A lower inflation rate doesn’t mean prices are dropping; it simply indicates that prices are increasing at a slower pace compared to previous periods.
Since early 2020, consumer prices have skyrocketed across several metro areas:
- Tampa-St. Petersburg-Clearwater Metro Area: Prices have surged nearly 30%.
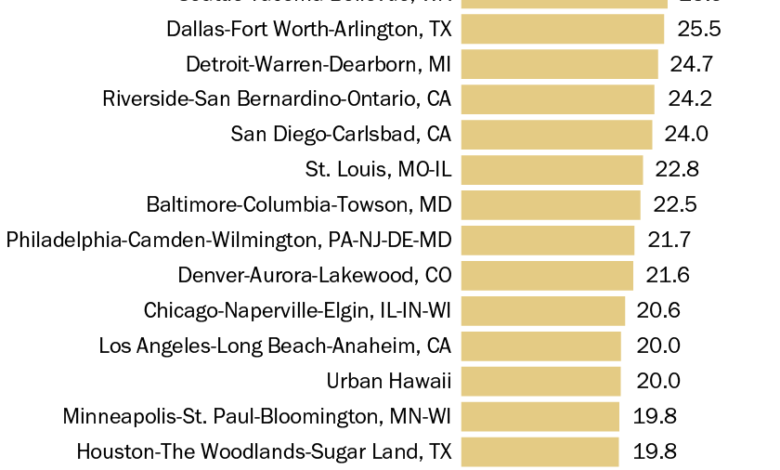
- San Diego-Carlsbad: A significant increase of 24% in overall consumer costs.
- San Francisco-Oakland-Hayward: Prices rose by 16.6%, a smaller jump but starting from an already high base.
Electricity and Rent Trends by Metro Area
San Francisco Bay Area: Electricity prices have soared by nearly 66%, marking the highest increase among the metros studied. However, rent for primary residences rose only 8.9%, the smallest growth, though rents were already steep.
Alcoholic Beverage Costs
Seattle-Tacoma-Bellevue: Alcohol prices have climbed by 35% since February 2020.
Miami-Fort Lauderdale-West Palm Beach: Interestingly, alcohol prices dropped by 7.3%, making it the most budget-friendly choice for drinkers.
To identify where consumer prices have surged the most and least in recent years, we analyzed inflation data from the U.S. Bureau of Labor Statistics (BLS) across 23 major metropolitan areas, representing over a third of the U.S. population. This comprehensive review focused on price changes for 20 essential items included in the Consumer Price Index for All Urban Consumers (CPI-U).
From early 2020 to mid-2024, inflation rates exceeded the national average in 11 of the 23 metro areas analyzed. Leading the pack were three Southeastern cities: Tampa-St. Petersburg-Clearwater, Miami-Fort Lauderdale-West Palm Beach, and Atlanta-Sandy Springs-Roswell.
The primary driver behind Tampa-St. Petersburg-Clearwater’s top position is the steep rise in housing costs. Housing expenses—tracked through “rent of primary residence” and “owners’ equivalent rent of primary residence” (OER)—carry significant weight in the CPI-U, accounting for roughly one-third of the index. Even modest increases in these categories can heavily influence overall inflation rates. Since 2020, Tampa-St. Petersburg-Clearwater has seen the sharpest increases in both rent (up 46.9%) and OER (up 44.6%) among all the areas studied, pushing it to the forefront of inflation growth.


