How Much Money You Need to Join the Top 1% in the 50 Largest U.S. Cities

We broke down the estimated income you’d need to be considered part of the 1% in each of the 50 largest U.S. cities using recent IRS data and regional income thresholds. The results might surprise you.
Why the 1% Threshold Varies by City
The top 1% is typically calculated at the metro area level, not nationwide. That’s because wealth is extremely localized. Living like a one-percenter in San Francisco costs a lot more than doing so in Cleveland. In fact, some cities have such high income inequality that the top 1% earn 30+ times more than the bottom 99%.
This list focuses on income needed — not net worth — which means this is about how much annual income you’d need to earn from salary, capital gains, businesses, and more.
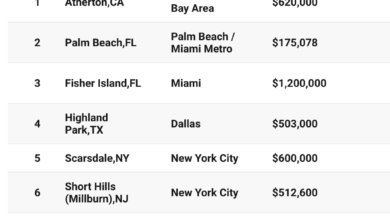
Income Needed to Be in the Top 1% by City
Here’s a snapshot of what it takes to be in the top 1% across the 50 largest metro areas in the U.S.
What This Means for You
Whether you’re aiming to join the 1%, or just curious about how your income compares, these numbers offer perspective on wealth concentration in urban America.
In some cities, especially in California and the Northeast, the top 1% income level is nearing — or surpassing — $1 million per year. These areas also tend to have high living costs, meaning it’s more expensive to “feel” rich even at those levels.
On the other hand, cities in the South and Midwest show that you can be among the wealthiest earners with a significantly lower income — at least by comparison.
What’s Driving These Numbers?
- Local economies: Tech hubs like San Francisco and Seattle have surged due to stock-based compensation and startup exits.
- Cost of living: Expensive housing markets correlate with higher income thresholds.
- Income inequality: Cities with high inequality have higher 1% thresholds because the top earners are pulling far away from the middle class.
Being in the top 1% is more than a bragging right — it’s a reflection of deep economic trends and wealth gaps in America. Whether your city’s threshold is $400,000 or $950,000, these numbers help highlight how uneven prosperity can be depending on your zip code.


