Estimated Net Worth Across Seattle Neighborhoods (2026)
Seattle has become one of the fastest-growing wealth centers in the United States, driven by a strong technology sector, rising home values, and high household incomes. But wealth across the Seattle metro area is far from evenly distributed.
Some neighborhoods have accumulated significant household wealth through decades of home appreciation and higher incomes, while others remain more affordable but show lower estimated net worth levels.
This analysis compares Seattle neighborhoods by estimated household net worth, using income levels, home values, and typical housing equity patterns to understand where wealth appears to be concentrated across the metro area.
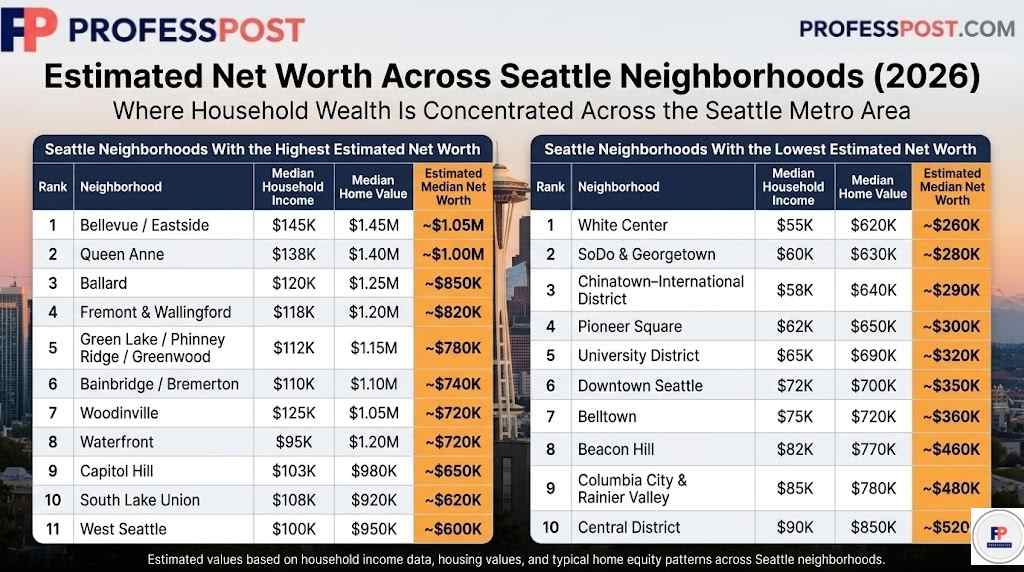
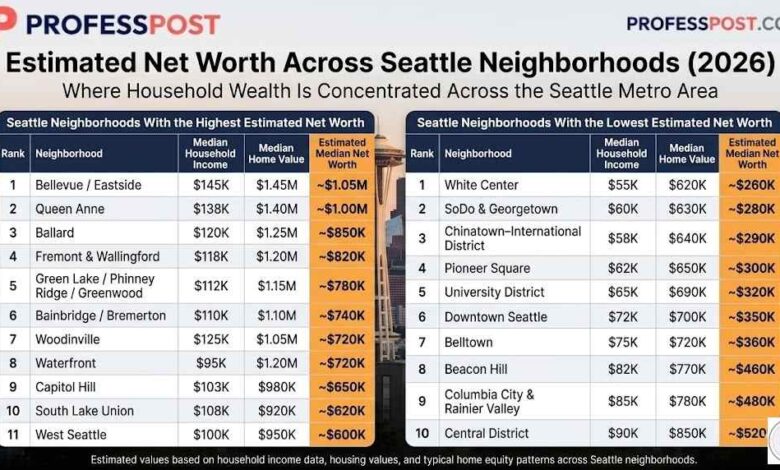
Seattle Neighborhoods With the Highest Estimated Net Worth
Neighborhoods with the highest estimated wealth tend to combine strong household incomes with expensive real estate markets. Many of these areas also have high homeownership rates and long-term housing appreciation.
| Rank | Neighborhood | Median Household Income | Median Home Value | Estimated Median Net Worth |
|---|---|---|---|---|
| 1 | Bellevue / Eastside | $145K | $1.45M | ~$1.05M |
| 2 | Queen Anne | $138K | $1.40M | ~$1.00M |
| 3 | Ballard | $120K | $1.25M | ~$850K |
| 4 | Fremont & Wallingford | $118K | $1.20M | ~$820K |
| 5 | Green Lake / Phinney Ridge / Greenwood | $112K | $1.15M | ~$780K |
| 6 | Bainbridge / Bremerton | $110K | $1.10M | ~$740K |
| 7 | Woodinville | $125K | $1.05M | ~$720K |
| 8 | Waterfront | $95K | $1.20M | ~$720K |
| 9 | Capitol Hill | $103K | $980K | ~$650K |
| 10 | South Lake Union | $108K | $920K | ~$620K |
| 11 | West Seattle | $100K | $950K | ~$600K |
Seattle Neighborhoods With the Lowest Estimated Net Worth
Lower estimated net worth neighborhoods typically reflect lower median incomes and more affordable housing markets. While housing values may still be high by national standards, lower homeownership rates and smaller accumulated housing equity contribute to lower estimated household wealth.
| Rank | Neighborhood | Median Household Income | Median Home Value | Estimated Median Net Worth |
|---|---|---|---|---|
| 1 | White Center | $55K | $620K | ~$260K |
| 2 | SoDo & Georgetown | $60K | $630K | ~$280K |
| 3 | Chinatown–International District | $58K | $640K | ~$290K |
| 4 | Pioneer Square | $62K | $650K | ~$300K |
| 5 | University District | $65K | $690K | ~$320K |
| 6 | Downtown Seattle | $72K | $700K | ~$350K |
| 7 | Belltown | $75K | $720K | ~$360K |
| 8 | Beacon Hill | $82K | $770K | ~$460K |
| 9 | Columbia City & Rainier Valley | $85K | $780K | ~$480K |
| 10 | Central District | $90K | $850K | ~$520K |
Why Wealth Varies Across Seattle Neighborhoods
Several factors help explain why household wealth differs significantly across neighborhoods in the Seattle metro area:
- Housing appreciation: Areas with long-term home price growth accumulate significant housing equity.
- Income concentration: Higher salaries, especially in technology and professional services, contribute to faster wealth accumulation.
- Homeownership rates: Neighborhoods with more homeowners tend to build wealth through property appreciation.
- Housing affordability history: Areas that were previously affordable often see large wealth gains as property values increase.
Housing Costs Play a Major Role in Wealth Building
Homeownership remains one of the largest drivers of household wealth in the United States. In cities like Seattle, where housing prices have increased dramatically over the past decade, homeowners who purchased earlier have often seen substantial increases in home equity.
Understanding local income levels is also critical when evaluating housing affordability. Our analysis of how much income you need to buy a home in Seattle metro neighborhoods explores the salary levels typically required to enter these housing markets.
Similarly, renters face different affordability pressures across neighborhoods. Our breakdown of rent vs income across the greater Seattle metro area highlights where housing costs consume the largest share of local incomes.
Income Still Shapes the Seattle Cost-of-Living Experience
While housing wealth plays a major role in overall net worth, income levels also shape how comfortable daily life feels across the city. Our analysis of what income actually feels comfortable in Seattle shows how salary levels interact with housing costs and overall cost of living.
For broader perspective, our national comparison of salary purchasing power across major U.S. cities illustrates how income stretches differently depending on location.
Methodology
This analysis estimates neighborhood-level household wealth using a combination of publicly available economic indicators.
- Median household income estimates are based on U.S. Census American Community Survey data.
- Median home values reflect housing market estimates derived from regional real estate datasets and typical neighborhood price ranges.
- Estimated median net worth reflects typical household wealth patterns using home equity assumptions, income levels, and general asset accumulation trends.
These figures should be interpreted as approximate estimates intended to illustrate relative differences across neighborhoods, rather than precise measurements of household wealth.
Bottom Line
Seattle’s wealth landscape reflects a combination of high incomes, expensive housing, and long-term real estate appreciation. While some neighborhoods show estimated household wealth approaching or exceeding $1 million, others remain far more affordable and show lower overall net worth levels.
As housing markets and incomes continue to evolve across the region, these neighborhood differences will remain a defining feature of Seattle’s economic landscape.