How Much You Really Take Home: Median Salaries, After-Tax Income & Wage Loss Rates Across 30 Major U.S. Cities (2025)

Explore how median salaries, after-tax incomes, and wage loss rates vary across 30 major U.S. cities, revealing where your paycheck truly goes in 2025.
Key Takeaways
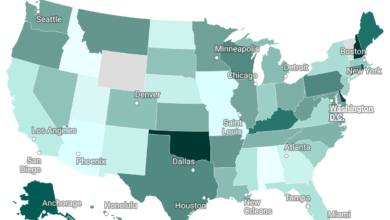
- High-Cost, High-Salary Cities: Cities like New York, San Francisco, and Boston have high median salaries but also high tax rates and living costs, resulting in significant wage loss rates of 30–36%.
- Tax-Friendly Cities: Texas cities such as Austin, Dallas, and Houston benefit from no state income tax, reducing wage loss rates to around 25–28%, which increases disposable income despite slightly lower median salaries.
- Balanced Cities: Cities like Charlotte, NC, and Denver, CO, strike a balance between median salary and wage loss rate, providing moderate after-tax incomes with manageable taxation.
Choosing where to work or live in the U.S. requires more than just looking at gross salaries. The actual take-home pay—, after income taxes—and the effective wage loss rate can significantly influence purchasing power and lifestyle. This analysis examines median annual salaries, after-tax incomes, and wage loss rates across, 30 major U.S cities in 2025.
Understanding Median Salaries and After-Tax Income
Median salary is the midpoint income in a city—half of the population earns more, and half earns less. However, the amount you actually take home depends heavily on taxes. Wage loss rate represents the portion of your salary lost to federal, state, and local taxes. For example, New York City shows a high median salary of $95,220, but residents lose approximately 36% to taxes, leaving an after-tax income of $61,000. In contrast, Austin, TX, with a lower median salary of $59,828, has a smaller wage loss rate of 25%, leading to an after-tax income of $45,000.
Why Cities in the Same State Can Have Different Rates
Even within the same state, cities often display significant differences in median salaries, after-tax incomes, and wage loss rates. This variation can be attributed to several factors:
- Local Taxes: Some cities impose municipal or local income taxes in addition to state taxes. For instance, Columbus, OH, has city-level income taxes that increase wage loss compared to other Ohio cities.
- Cost of Living and Wage Adjustments: Cities with higher living costs often offer higher salaries to attract skilled workers. For example, San Francisco and San Diego in California have higher median salaries than Fresno, despite being in the same state.
- Economic Activity: Cities with concentrated industries, such as tech in San Jose or finance in New York, naturally command higher wages than cities with more service-oriented economies.
- State-Level Policies: States like Texas have no state income tax, lowering the overall wage loss rate. Yet even within Texas, wage loss rates vary slightly due to municipal costs and local living expenses.
How Wage Loss Rates Affect Purchasing Power
Wage loss rate is a crucial metric for understanding real income. Two cities may have similar gross salaries but vastly different after-tax incomes. For example, a $65,000 salary in San Antonio (wage loss 25%) results in $45,000 take-home, while a similar salary in Philadelphia (wage loss 29%) results in only $50,000 take-home. Over time, these differences influence savings, investment potential, and lifestyle choices.