Data VisualizationEconomyFinance

What It Takes to Join the Top 5% of Earners in Every State

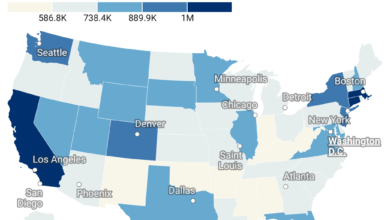
To match the average income of the top 5% of earners in the wealthiest U.S. states, you’d need to make more than $500,000 a year, according to a recent analysis by GOBankingRates.

A new study from GOBankingRates found that the average income for the highest-earning households now exceeds $500,000 a year in 12 states. The analysis was based on the most recent U.S. Census data from 2023.

Study reveals a significant income gap in several U.S. states, particularly those with a high cost of living. In five states, the top 5% of earners make $600,000 or more annually. These states are Connecticut, where the threshold is $637,673, followed by California at $619,938, Massachusetts at $619,385, New York at $619,178, and New Jersey at $616,334.

In total, twelve states see their top 5% of earners making more than half a million dollars a year. Joining the top five are Washington ($573,110), Colorado ($535,056), Virginia ($534,776), Maryland ($522,117), Illinois ($514,347), New Hampshire ($510,730), and Hawaii ($505,977).

The income disparity is most pronounced in New York, the only state where the top 5% earn seven times more than the median household income. This gap is also substantial in 24 other states, where the top 5% make six times the median income, and in the remaining 25 states, they earn five times as much.

How Much You Need To Be in the Top 5% in Every State 


Source
For this study, GOBankingRates analyzed US states to find how much income you need to be in the top 5% earners in every state. For each state a number of factors were found including total population, population ages 65 and over, total households, household median income, the lower limit of household income for each quintile, and the average household income for each quintile, all were sourced from the US Census American Community Survey. The cost-of-living indexes for each state were recorded from Missouri Economic and Research Information Center and using the national average expenditure costs from the Bureau of Labor Statistics Consumer Expenditure Survey for all households, the average expenditure costs for each state was calculated. The average single family home value was sourced from Zillow Home Value Index and using the national average 30-year fixed mortgage rate, as sourced from the Federal Reserve Economic Data, the average mortgage cost can be calculated. Using the average mortgage and expenditure costs the total cost of living can be calculated and is included as supplemental information. The states were sorted to show the highest average income for the top 5% household earners. All data was collected on and is up to date on April 30th, 2025.

Related Articles

Leave a Reply

Your email address will not be published. Required fields are marked *