Where the Money Really Goes: How Average City Salaries Are Spent in 2025
Key Takeaways
- Housing dominates in coastal cities: In metros like San Francisco, New York, and Los Angeles, housing alone eats up 35–40% of income — nearly double what residents of Dallas or Kansas City pay as a share of earnings.
- Taxes take the next biggest bite: Workers in California, New York, and Massachusetts surrender roughly 25–30% of their gross income to federal, state, and payroll taxes. In contrast, residents of Texas, Florida, and Nevada benefit from no state income tax, saving 5–7% of gross pay.
- Transportation and food costs vary by region: Car-dependent cities like Atlanta, Dallas, and Phoenix see transportation account for around 10–11% of income. By contrast, walkable metros with solid public transit — like New York or Boston — spend closer to 8%.
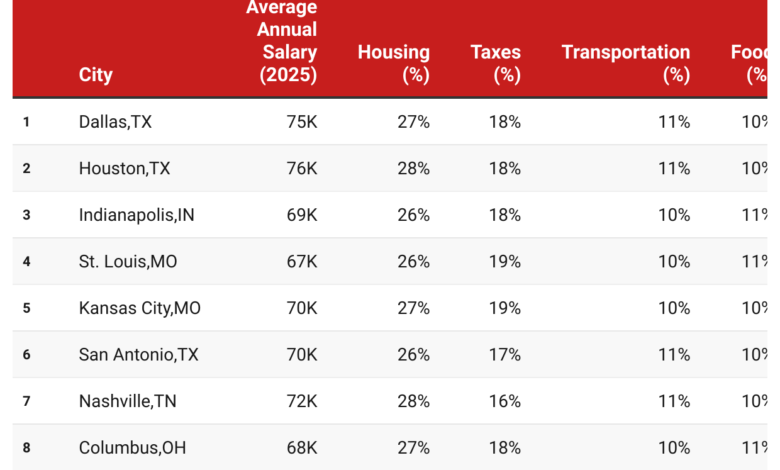
- The real winners: Southern metros: Cities such as Nashville, San Antonio, and Houston leave residents with 20% or more of their salary after taxes and living expenses. In high-cost metros, that leftover can shrink to just 5% or less.
The average American salary looks decent on paper — around $78,000 in 2025 — but where does it all go? Between rent, taxes, transportation, and daily expenses, most workers in big cities are left with far less disposable income than they imagine.
To find out just how much the average paycheck stretches, we analyzed 20+ major U.S. cities to see where residents spend the biggest portions of their income. Using data from the Bureau of Labor Statistics (BLS), Numbeo, Zillow, and the Tax Foundation, we broke down how salaries get divided into six core categories: housing, taxes, transportation, food, healthcare, and miscellaneous costs.
Visualizing the Difference
Imagine earning $85,000 in New York versus $75,000 in Dallas:
- In New York, housing and taxes alone consume about 65% of gross pay.
- In Dallas, those same two expenses total just 45%, leaving roughly $15,000 more per year in disposable income.
That $15,000 gap can cover a car payment, a vacation fund, or maxing out a retirement account — showing how much location dictates lifestyle.
How These Figures Were Calculated (Methodology Summary)
To make this comparison meaningful, we combined national averages from the Bureau of Labor Statistics (BLS) with city-level cost-of-living data from Numbeo, Zillow, and the Tax Foundation.
- Base salary by city: We used 2025 estimates for average annual salaries from BLS Local Area Wage and Census/ACS data.
- Expense shares: Starting with national household spending proportions from the BLS Consumer Expenditure Survey, we adjusted them for each city using Numbeo price indices and Zillow rent data to account for local housing markets.
- Taxes: Federal and state income taxes were estimated using IRS effective tax averages and Tax Foundation state tax rates, plus payroll (FICA/Medicare) contributions.
- Normalization: After housing, taxes, food, transportation, healthcare, and miscellaneous costs were calculated, the remaining share was considered “discretionary income” — money available for savings or leisure.
This hybrid method blends real data with localized cost scaling, giving a consistent picture across metros. While it’s not a substitute for an exact household budget, it accurately reflects relative purchasing power between cities.