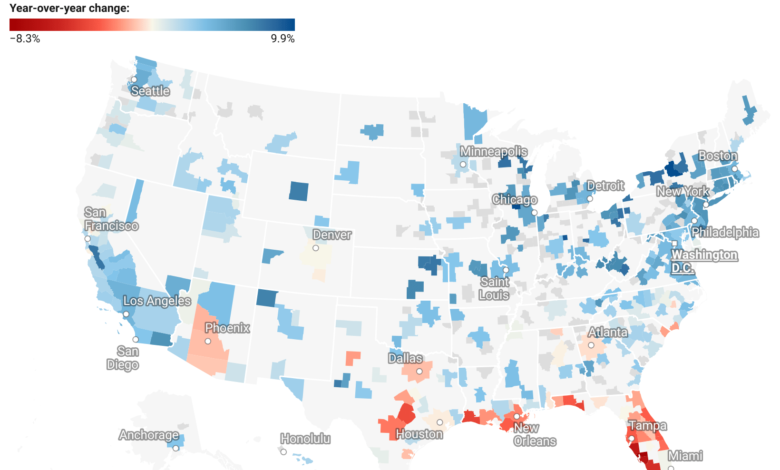
Year-over-Year Change in Metro Areas Home Prices: December 2023 to December 2024
Home prices are up 2.6% yearly, with declines in some regions, while the Northeast, Midwest, and West Coast see stronger gains.
National home prices have increased by 2.6% year-over-year. While some markets in the Gulf and Mountain West regions are experiencing slight declines, others—mainly in the Northeast, Midwest, and West Coast—are seeing significantly higher gains than the national average.
The map below illustrates the one-year change in home prices across U.S. metropolitan housing markets from December 2023 to December 2024. This analysis is based on the latest Zillow Home Value Index data, as analysis by Professpost.com.

Home prices have declined in Gulf markets such as Texas, Florida, and Louisiana, where inventory has rebounded above pre-pandemic levels. In contrast, most housing markets in the Northeast and Midwest continue to face inventory shortages, keeping home price growth elevated.
Many Sunbelt boomtowns that thrived during the pandemic are now facing mounting affordability challenges, along with rising home insurance costs and an oversupply of new homes. With pandemic-driven migration slowing and affordability becoming a greater concern, some areas are seeing an increased need for discounts to attract buyers.
In contrast, many markets in the Northeast and Midwest were less dependent on pandemic migration and have limited new-home construction. With less exposure to shifting demand, housing inventory in these regions has remained tight, giving sellers the upper hand.