How Long It Takes the Average Household to Reach $1 Million Net Worth in 20 Major U.S. Cities

How Long It Takes the Average Household to Reach $1 Million Net Worth in 20 Major U.S. Cities
Is becoming a millionaire still realistic for the average American household?
The answer depends heavily on where you live. In some U.S. cities, reaching a $1 million net worth could theoretically happen in under two decades with disciplined investing. In others, the same milestone could take nearly three decades—or even longer.
Location matters more than many people realize. Higher incomes can dramatically accelerate wealth-building, especially when paired with consistent investing and compound returns. But in lower-income metros, even households doing everything “right” may face a much longer path.
To estimate how long it takes the average household to reach $1 million in net worth, we analyzed median household income across 20 major U.S. cities and applied a consistent wealth-building model.
Our assumptions:
- 20% annual savings rate
- 7% average annual investment return
- $1,000,000 target net worth
- Median household income by city
The results are eye-opening.
Key Findings
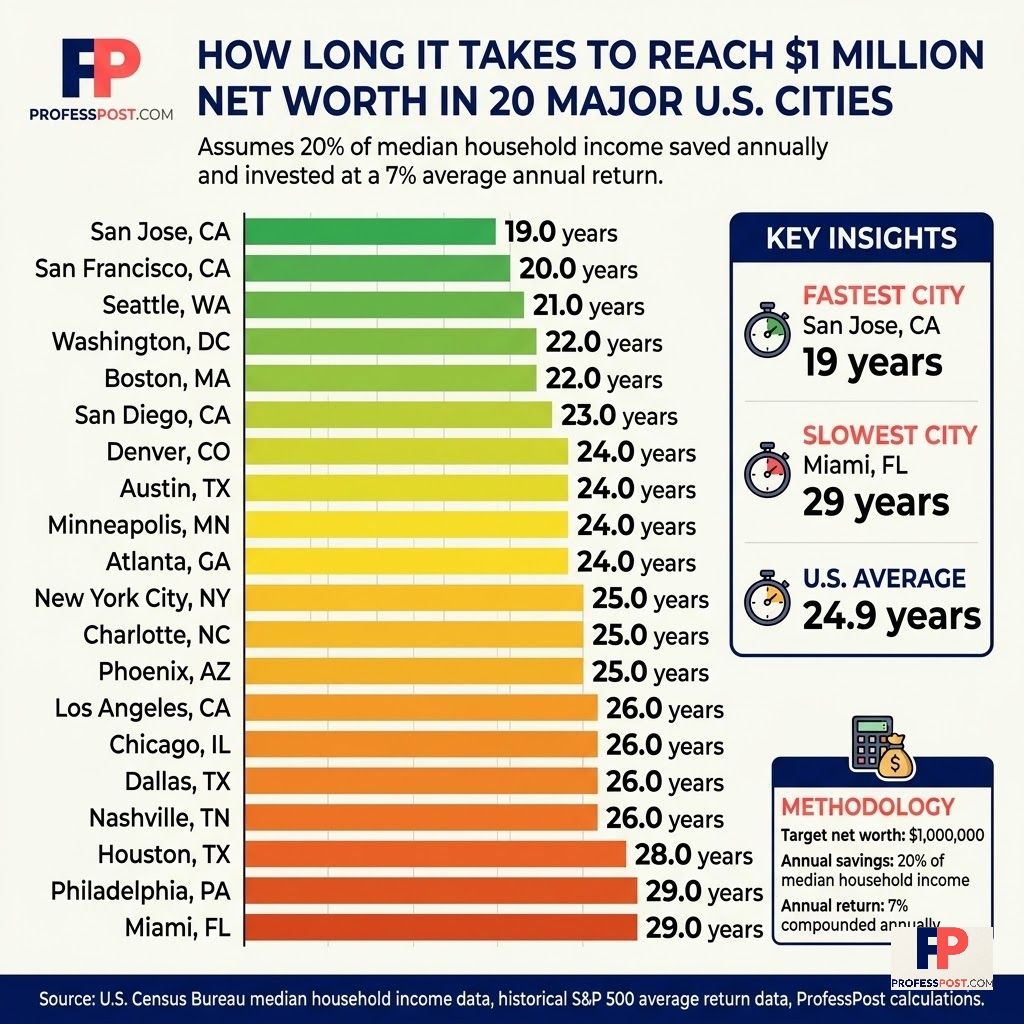
- Fastest city: San Jose — 19 years
- Slowest city: Miami — 29 years
- Average across all 20 cities: 24.9 years
- High-income tech hubs dominate the top rankings
- Popular Sun Belt cities often trail due to lower household incomes
- Even New York City doesn’t crack the top 10 fastest
Infographic
Full Ranking: Years to Reach $1 Million Net Worth
| Rank | City | Years |
|---|---|---|
| 1 | San Jose, CA | 19 |
| 2 | San Francisco, CA | 20 |
| 3 | Seattle, WA | 21 |
| 4 | Washington, DC | 22 |
| 5 | Boston, MA | 22 |
| 6 | San Diego, CA | 23 |
| 7 | Denver, CO | 24 |
| 8 | Austin, TX | 24 |
| 9 | Minneapolis, MN | 24 |
| 10 | Atlanta, GA | 24 |
| 11 | New York City, NY | 25 |
| 12 | Charlotte, NC | 25 |
| 13 | Phoenix, AZ | 25 |
| 14 | Los Angeles, CA | 26 |
| 15 | Chicago, IL | 26 |
| 16 | Dallas, TX | 26 |
| 17 | Nashville, TN | 26 |
| 18 | Houston, TX | 28 |
| 19 | Philadelphia, PA | 29 |
| 20 | Miami, FL | 29 |
Why San Jose Comes Out on Top
San Jose leads the ranking for one simple reason: income.
As the heart of Silicon Valley, San Jose has one of the highest median household incomes in America. Higher earnings mean larger annual investment contributions, and compound growth does the rest.
Even though San Jose has extremely high living costs, this model focuses strictly on income-based investing assumptions—not actual spending behavior.
That distinction matters.
Why Miami Ranks Last
Miami often feels wealthy from the outside.
Luxury condos, high-end retail, waterfront real estate, and affluent neighborhoods create the perception of widespread prosperity.
But median household income tells a different story.
Compared with cities like San Jose or Seattle, average household earnings in Miami are significantly lower, which slows wealth accumulation dramatically under identical savings assumptions.
New York City’s Surprisingly Middling Position
Many readers may expect New York City to rank near the top.
But NYC lands at #11.
Why?
Although incomes are relatively strong, New York doesn’t match elite tech markets like San Jose or San Francisco on a median household basis.
And while this model doesn’t directly subtract living expenses, median income still determines contribution size.
The Methodology
Transparency matters—especially with finance content.
Here’s exactly how this analysis was built.
Step 1: Median Household Income by City
We used city-level median household income estimates based on the latest publicly available U.S. Census Bureau American Community Survey benchmarks.
Median household income was chosen instead of average income because median figures better represent the “typical” household and are less distorted by ultra-high earners.
Step 2: Savings Rate Assumption
We assumed each household saves and invests 20% of gross household income annually.
Why 20%?
This rate reflects an ambitious but widely discussed long-term wealth-building benchmark among personal finance experts.
It’s aggressive enough to create meaningful investment growth while remaining theoretically achievable for higher-income households.
Step 3: Investment Return Assumption
We assumed a 7% average annual compounded return.
This reflects a conservative long-term stock market assumption after adjusting historical S&P 500 performance for inflation and variability.
Actual returns can vary significantly year to year.
Step 4: Compound Growth Calculation
Each city’s estimated annual contribution was calculated as:
Median Household Income × 20%
That annual amount was then compounded at 7% until the portfolio exceeded $1,000,000.
This follows a future value compounding model similar to long-term retirement accumulation projections.
Example: San Jose
Approximate median household income: $136,000
20% annual savings: $27,200
At 7% annual growth, repeated yearly contributions reach $1 million in approximately 19 years.
Important Limitations
- Assumes constant income over time
- Assumes uninterrupted employment
- Does not account for taxes
- Does not include debt obligations
- Does not adjust for inflation in spending behavior
- Does not include housing equity unless liquidated/invested
- Assumes disciplined annual investing every year
- Household structure varies significantly by city
This analysis is best viewed as a standardized comparison—not a personal financial guarantee.
Sources
U.S. Census Bureau
Median household income estimates by city via American Community Survey data.
S&P Dow Jones Indices
Historical long-term stock market return benchmarks used to support 7% growth assumptions.
Federal Reserve Survey of Consumer Finances
Background wealth distribution context for household net worth comparisons.
Bureau of Labor Statistics
Supplementary wage and labor market context.
FAQ
Is $1 million enough to retire?
It depends heavily on lifestyle, healthcare costs, location, and retirement age.
Does this include home equity?
No. This model focuses on invested savings accumulation, not housing appreciation.
Why isn’t New York ranked higher?
Median household income in NYC trails top-tier tech metros.
Is 20% savings realistic?
For some households yes, for many households no. This is a standardized modeling assumption.
Final Takeaway
Becoming a millionaire isn’t only about discipline.
Geography plays a massive role.
Two households making “average” incomes in different U.S. cities can face wealth-building timelines separated by an entire decade.
That’s the hidden power of location.