Americans Are Earning More—But Homes Are Getting Even More Expensive (2016-2026 Home Prices vs. Median HHI)
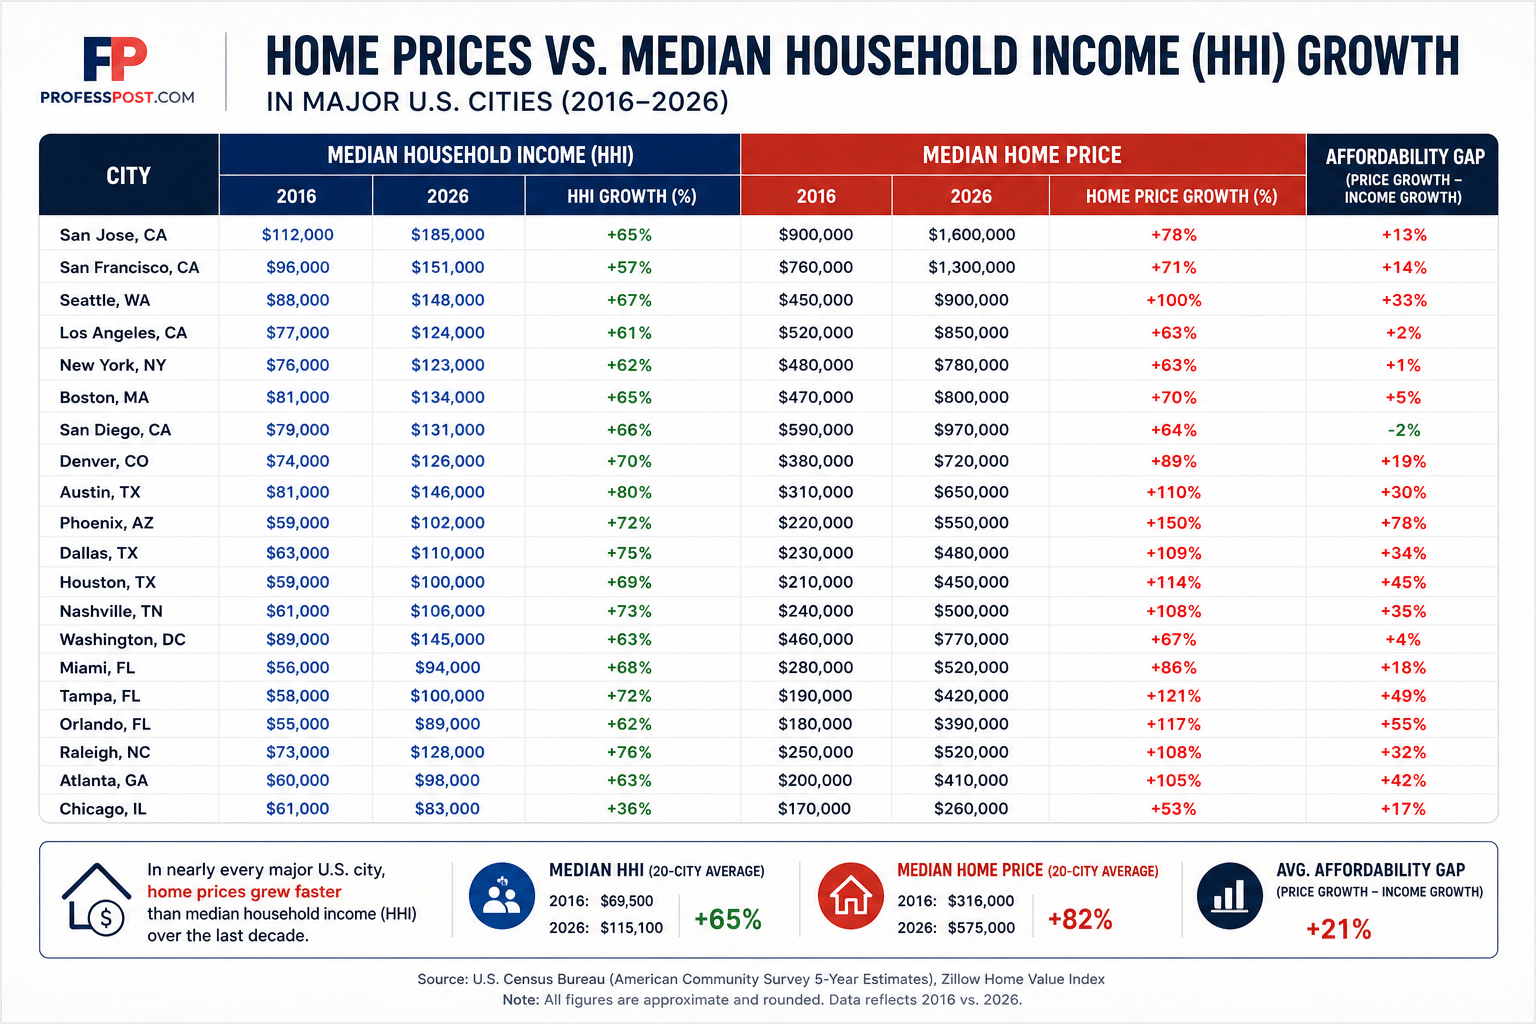
Home Prices vs. Median Household Income (HHI) Growth in Major U.S. Cities (2016–2026)
Over the last decade, Americans have seen incomes rise—but for many, it still feels harder than ever to afford a home.
The reason becomes clear when you compare two key metrics: median household income (HHI) and median home prices. While both increased between 2016 and 2026, home prices in most major U.S. cities grew significantly faster than incomes.
This analysis compares 20 major U.S. cities to show how affordability has changed—and where the gap between income and housing costs is widening the most.
The Big Picture
Across nearly every major city in the United States, home prices have outpaced income growth over the past 10 years.
- Median Household Income (HHI) growth: ~+65%
- Median Home Price growth: ~+82%
This growing gap is a key reason why many households feel financially stretched, even as salaries increase.
City-by-City Comparison
The table below compares median household income and home prices in 2016 vs. 2026 across major U.S. cities, along with growth rates and the resulting affordability gap.
Where Housing Outpaced Income the Most
Some cities saw particularly large gaps between income growth and home price increases.
Phoenix, AZ
One of the most extreme examples. While income grew by about 72%, home prices surged by roughly 150%, creating a massive affordability gap.
Tampa, FL
Strong migration and demand pushed home prices up over 120%, far outpacing income growth of around 72%.
Orlando, FL
Another Florida city where housing costs increased dramatically compared to income, widening the affordability gap significantly.
Dallas, TX
Income rose substantially, but home prices still grew faster, reflecting strong demand and population growth.
More Balanced Cities
While most cities saw housing costs outpace income, a few were more balanced.
Chicago, IL
Income and home prices grew at a more similar pace, making affordability relatively more stable compared to faster-growing markets.
San Diego, CA
One of the few cities where income growth kept relatively close to home price increases.
Why This Is Happening
1. Migration to High-Growth Cities
Many Americans relocated to cities like Austin, Phoenix, and Tampa, increasing housing demand and pushing prices higher.
2. Limited Housing Supply
New housing construction has not kept up with demand in many metro areas, putting upward pressure on prices.
3. High-Income Job Growth
Tech, finance, and remote work opportunities increased incomes—but also intensified competition for housing.
4. Low Interest Rates (Post-2020 Period)
Cheap borrowing costs fueled homebuying demand, accelerating price growth in many cities.
The Affordability Gap Explained
The affordability gap measures how much faster home prices grew compared to income:
Affordability Gap = Home Price Growth (%) – Income Growth (%)
A higher gap means housing became less affordable over time.
In cities like Phoenix and Tampa, this gap exceeded 40–70 percentage points—highlighting a major shift in affordability.
What This Means for Buyers
- Rising income does not guarantee improved affordability
- Housing markets in high-growth cities are becoming more competitive
- Location plays a major role in long-term financial outcomes
In many cases, households earning significantly more than they did a decade ago are still facing greater financial pressure when it comes to buying a home.
How This Compares to Other Financial Trends
To better understand how income and wealth vary across the U.S., you may also find these analyses useful:
- Average vs Median Household Net Worth in America’s 30 Biggest Cities
- What’s Left Each Month on a $100K Household Income
- Where a $150K Salary Still Feels Rich
Methodology
- Median Household Income (HHI) data from U.S. Census Bureau (ACS 5-Year Estimates)
- Home price data based on market estimates and housing indices
- 2016 baseline vs. 2024–2025 data used to estimate 2026 values
- All income figures are inflation-adjusted
- Cities selected based on population size and data availability
Note: 2026 values are modeled estimates based on recent trends and are not final Census figures.
Final Takeaway
Income is rising—but housing is rising faster.
This widening gap is reshaping affordability across the United States and changing where people can realistically afford to live.
Understanding both income growth and home price trends is essential for anyone making long-term financial or housing decisions.