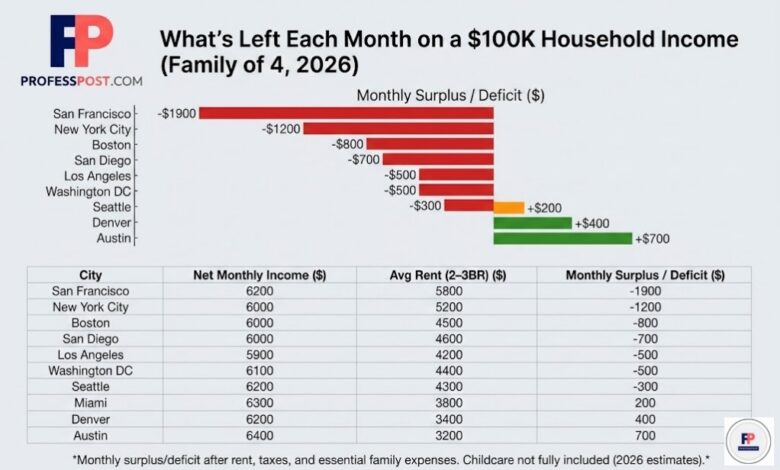
What’s Left Each Month on a $100K Household Income (Family of 4, 2026)
What’s Left Each Month on a $100K Household Income (Family of 4, 2026 Reality Check)
A $100K household income sounds solid on paper. In many parts of the U.S., it still represents a stable middle-class lifestyle.
But in America’s most expensive cities, that number tells a very different story. Once you factor in housing, taxes, and basic family expenses, the question becomes simple:
How much money is actually left at the end of the month?
This breakdown reveals the reality for a family of four living on $100K in 10 major U.S. cities in 2026.
Monthly Financial Reality by City (Family of 4, $100K Income)
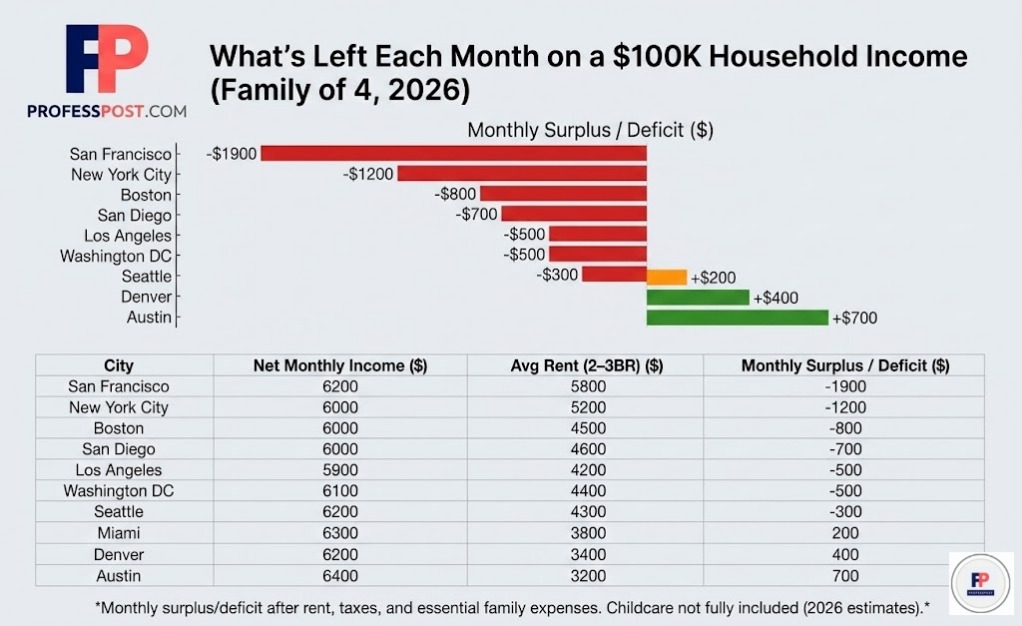
| City | Net Monthly Income ($) | Avg Rent (2–3BR) ($) | Monthly Surplus / Deficit ($) |
|---|---|---|---|
| New York City | 6,000 | 5,200 | -1,200 |
| San Francisco | 6,200 | 5,800 | -1,900 |
| Los Angeles | 5,900 | 4,200 | -500 |
| Boston | 6,000 | 4,500 | -800 |
| Seattle | 6,200 | 4,300 | -300 |
| Washington DC | 6,100 | 4,400 | -500 |
| San Diego | 6,000 | 4,600 | -700 |
| Miami | 6,300 | 3,800 | 200 |
| Austin | 6,400 | 3,200 | 700 |
| Denver | 6,200 | 3,400 | 400 |
Monthly surplus/deficit reflects what remains after rent, taxes, and essential expenses for a family of four. Childcare not fully included.
What This Data Actually Means
In cities like New York and San Francisco, housing alone can consume nearly an entire paycheck. In fact, average rents in these cities regularly exceed $3,000–$3,500 for smaller units and go much higher for family-sized housing.
For families, the situation is even more extreme. Basic living costs (excluding rent) can already exceed $6,000 per month in cities like New York and San Francisco.
This creates a structural gap where income simply cannot keep up with expenses.
Reality Check: $100K Isn’t What It Used to Be
A decade ago, a $100K household income could comfortably support a family in most U.S. cities.
In 2026, that’s no longer true in high-cost metros.
- New York City: Deep monthly deficit
- San Francisco: One of the largest affordability gaps in the country
- Los Angeles & Boston: Constant financial pressure
- Austin & Denver: Only cities with meaningful breathing room
This aligns with broader trends showing that housing remains the single biggest driver of cost-of-living differences across cities.
Why Families Feel the Pressure More
The gap between income and expenses widens significantly for families due to:
- Larger housing requirements (2–3 bedrooms)
- Higher grocery costs
- Transportation expenses (often multiple vehicles)
- Healthcare and insurance
And most importantly:
Childcare is not fully included in this model.
In many cities, childcare alone can add $1,000–$2,500 per month — turning small surpluses into immediate deficits.
Location Matters More Than Income
This analysis highlights a key shift in the modern economy:
Where you live now matters more than how much you earn.
The same $100K income can mean:
- Financial stress in coastal cities
- Relative stability in mid-cost metros
For example, if you’re comparing different income levels and locations, you may also want to read:
- Where a $150K Salary Still Feels Rich
- Income Needed to Live Alone in U.S. Cities
- What a $200K Salary Buys in the Bay Area
- $250K Salary Reality Check
- Home Insurance Costs by City
Final Takeaway
A $100K household income is still a strong salary in many parts of the United States.
But in America’s most expensive cities, it’s no longer enough to comfortably support a family of four.
In fact, in several major metros, it doesn’t even cover basic monthly expenses.
In 2026, income alone doesn’t define financial comfort — location does.
📌 Methodology
This analysis estimates the monthly financial outcome for a family of four earning $100,000 annually in 2026.
- Net income is calculated after federal and state taxes (~$6,000–$6,400/month)
- Housing costs reflect average 2–3 bedroom rental prices in major U.S. cities
- Expenses include:
- Rent
- Utilities
- Groceries
- Transportation
- Basic healthcare
Childcare, debt payments, and discretionary spending are not fully included.
All figures represent estimated averages and are intended for comparison purposes only.
📚 Sources
- U.S. cost of living data (Numbeo, 2026)
- Rent data across major U.S. cities
- National rent averages and housing trends
- Cost of living calculators and benchmarks