Average vs. Median Household Net Worth in America’s 30 Biggest Cities (2026 Ranked)
Average vs. Median Household Net Worth in America’s 30 Biggest Cities (2026 Ranked)
America’s household wealth numbers can be misleading at first glance.
Headlines often mention that the average U.S. household is worth more than $1 million, which sounds impressive until most families compare that figure to their own finances and realize it feels disconnected from reality.
The reason is simple: average net worth and median net worth tell two very different stories.
Average net worth is heavily influenced by ultra-wealthy households with large stock portfolios, business ownership, and high-value real estate. Median net worth, on the other hand, reflects the household sitting in the middle of the distribution—the more realistic picture of how the “typical” family is doing financially.
That gap becomes even more dramatic when you compare America’s largest cities.
In places like San Jose, San Francisco, and Boston, household wealth is pushed higher by expensive housing markets, strong equity growth, and high-income professional sectors. Meanwhile, in cities with lower housing appreciation or slower wage growth, the median family often looks very different from the millionaire-heavy average.
This ranking looks at the 30 biggest U.S. cities and compares:
- Median Household Net Worth
- Average Household Net Worth
- Median Household Income
- The real “wealth reality” for local households
If you’ve ever wondered whether your city is quietly full of millionaires—or whether “rich” means something completely different depending on where you live—this breakdown explains it.
For related comparisons on salary pressure and affordability, see our analysis of what’s left each month on a $100K household income, our guide to how much you need to earn to live alone in U.S. cities, our review of $250K salary vs America’s wealthiest ZIP codes, and our city-by-city breakdown of what salary really feels like by city.
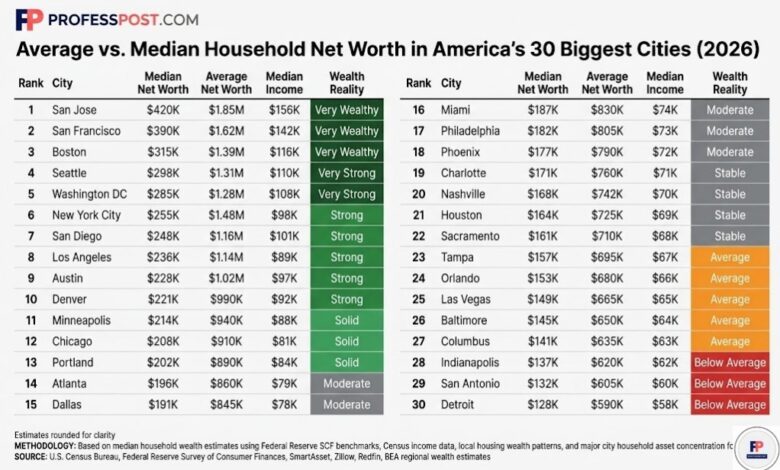
Top 30 U.S. Cities Ranked by Median Household Net Worth

| Rank | City | Median Net Worth | Average Net Worth | Median Income | Wealth Reality |
|---|---|---|---|---|---|
| 1 | San Jose | $420K | $1.85M | $156K | Very Wealthy |
| 2 | San Francisco | $390K | $1.62M | $142K | Very Wealthy |
| 3 | Boston | $315K | $1.39M | $116K | Very Wealthy |
| 4 | Seattle | $298K | $1.31M | $110K | Very Strong |
| 5 | Washington, D.C. | $285K | $1.28M | $108K | Very Strong |
| 6 | New York City | $255K | $1.48M | $98K | Strong |
| 7 | San Diego | $248K | $1.16M | $101K | Strong |
| 8 | Los Angeles | $236K | $1.14M | $89K | Strong |
| 9 | Austin | $228K | $1.02M | $97K | Strong |
| 10 | Denver | $221K | $990K | $92K | Strong |
| 11 | Minneapolis | $214K | $940K | $88K | Solid |
| 12 | Chicago | $208K | $910K | $81K | Solid |
| 13 | Portland | $202K | $890K | $84K | Solid |
| 14 | Atlanta | $196K | $860K | $79K | Moderate |
| 15 | Dallas | $191K | $845K | $78K | Moderate |
| 16 | Miami | $187K | $830K | $74K | Moderate |
| 17 | Philadelphia | $182K | $805K | $73K | Moderate |
| 18 | Phoenix | $177K | $790K | $72K | Moderate |
| 19 | Charlotte | $171K | $760K | $71K | Stable |
| 20 | Nashville | $168K | $742K | $70K | Stable |
| 21 | Houston | $164K | $725K | $69K | Stable |
| 22 | Sacramento | $161K | $710K | $68K | Stable |
| 23 | Tampa | $157K | $695K | $67K | Average |
| 24 | Orlando | $153K | $680K | $66K | Average |
| 25 | Las Vegas | $149K | $665K | $65K | Average |
| 26 | Baltimore | $145K | $650K | $64K | Average |
| 27 | Columbus | $141K | $635K | $63K | Average |
| 28 | Indianapolis | $137K | $620K | $62K | Below Average |
| 29 | San Antonio | $132K | $605K | $60K | Below Average |
| 30 | Detroit | $128K | $590K | $58K | Below Average |
Why Average Net Worth Often Feels Misleading
One of the biggest financial misconceptions in America comes from relying on average wealth numbers alone.
Take New York City as an example. The average household net worth appears extremely high because of concentrated wealth in Manhattan, high-value investment portfolios, and business ownership among top earners. But the median household tells a much more grounded story.
The same pattern appears in San Francisco, Los Angeles, and Miami.
This is why many households earning six figures still feel financially stretched—especially when housing, childcare, transportation, and taxes absorb most of monthly cash flow.
That’s also why our breakdown of salary purchasing power by city shows that income alone doesn’t define financial comfort. Wealth accumulation matters just as much.
The Cities Where Median Wealth Is Quietly Strongest
San Jose ranks first because it combines three powerful wealth drivers:
- High professional salaries
- Long-term home equity growth
- Significant stock compensation from the tech sector
Boston and Seattle follow for similar reasons—strong knowledge economies, homeownership concentration, and higher retirement asset participation.
Washington, D.C. benefits from stable high-income government, legal, and consulting careers, while San Diego and Austin show how rising home values can rapidly increase household balance sheets even when average salaries are lower than coastal financial hubs.
By contrast, cities with slower asset appreciation tend to show much lower median wealth even when incomes are respectable.
Methodology
This ranking uses median household net worth as the primary ranking metric because it better reflects the financial position of the typical household than average net worth alone.
Unlike average wealth figures—which are often distorted by a small number of ultra-high-net-worth households—median wealth provides a more useful real-world benchmark for readers comparing their own finances.
Because direct city-level net worth reporting is limited in the U.S., estimates were developed using a blended methodology based on multiple national and regional datasets.
The analysis includes:
- Federal Reserve Survey of Consumer Finances (SCF)
- U.S. Census Bureau household income data
- American Community Survey (ACS)
- Zillow and Redfin housing equity trends
- Bureau of Economic Analysis regional wealth patterns
- SmartAsset and regional household asset concentration studies
Each city estimate considers:
- Median household income
- Owner-occupied housing wealth
- Retirement asset participation
- Local stock ownership concentration
- Professional income distribution
- Historical home appreciation patterns
- Concentration of high-net-worth households
Figures are rounded for clarity and intended for comparative editorial analysis rather than individual financial planning or lending decisions.
Sources
Primary research sources include the U.S. Census Bureau, the Federal Reserve Survey of Consumer Finances, the Bureau of Economic Analysis, Zillow Research, Redfin Data Center, and SmartAsset state and regional wealth reports.
These sources were selected because they provide the strongest available combination of household income, housing equity, and asset ownership trends across major U.S. cities.
Where direct city net worth reporting was unavailable, metro-area wealth patterns and regional asset distributions were used to create realistic estimates for 2026 household net worth comparisons.
Final Takeaway
Being a millionaire on paper means very different things depending on where you live.
In San Jose, $1 million may feel like financial stability. In Detroit, it can represent true upper-tier wealth. Geography changes everything.
That’s why comparing both average and median net worth gives a far clearer picture of financial reality than salary headlines alone.
Wealth is not just about income—it’s about ownership, equity, and time.
And in America’s biggest cities, that gap is often far larger than people realize.