Top 10 NYC Neighborhoods Where Household Income Grew the Most in the Last 10 Years (2015–2026)
Top 10 NYC Neighborhoods Where Household Income Grew the Most in the Last 10 Years (2015–2026 Estimates)
New York City’s wealth map has changed dramatically over the past decade.
Some neighborhoods that were once considered “up-and-coming” are now firmly established as high-income enclaves. Others have seen sharp household income growth driven by new luxury development, tech and finance migration, rising home values, and a major shift in who can afford to live there.
Looking only at rent prices doesn’t tell the full story.
The stronger signal is household income growth—because it shows where higher-earning households are actually moving, buying, and staying.
According to the U.S. Census Bureau’s American Community Survey, New York City’s overall median household income increased from about $68,000 in 2010 to roughly $77,000 in 2023 (inflation-adjusted), though still below the city’s 2019 pre-pandemic peak of $83,000.
But citywide averages hide the real transformation happening at the neighborhood level.
Areas like Long Island City, Williamsburg, DUMBO, and Hudson Yards have seen income growth far above the city average, creating entirely new wealth patterns across the boroughs.
This article ranks the Top 10 NYC neighborhoods where household income grew the most from 2015 to 2026, using ACS benchmark data plus 2024–2026 adjusted estimates based on housing appreciation, high-income migration, and neighborhood development trends.
We’ll also compare them to NYC’s highest-HHI neighborhoods so readers can see the difference between “fastest growing” and “already ultra-wealthy.”
For related NYC affordability breakdowns, see our guides to where a $100K salary still feels comfortable, what a $250K salary can actually afford by neighborhood, and NYC’s wealthiest neighborhoods ranked.
Top 10 NYC Neighborhoods With the Biggest Household Income Growth
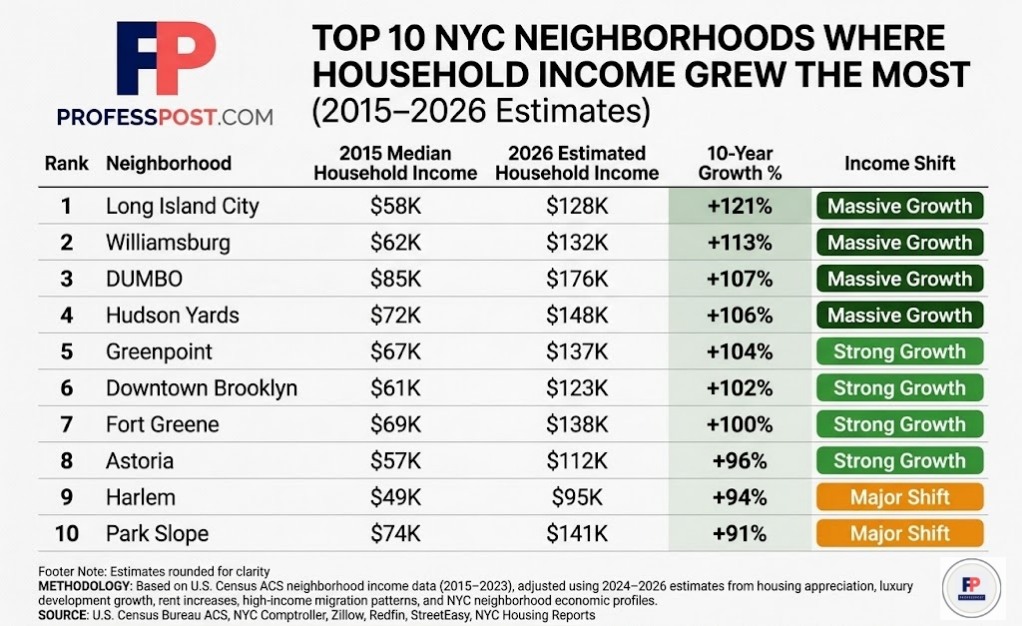
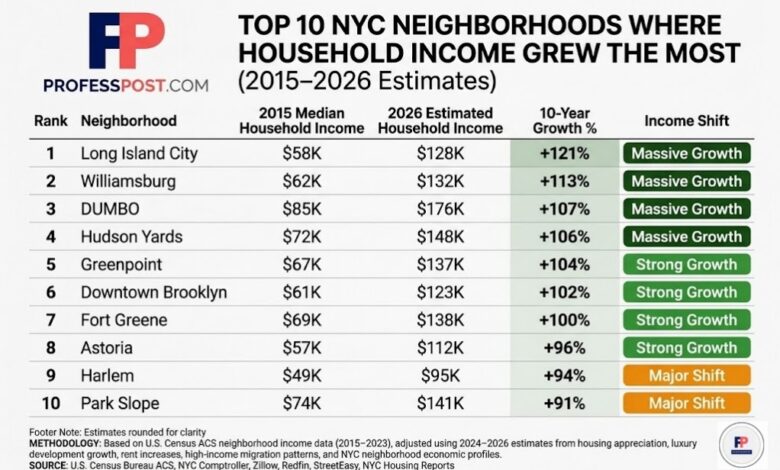
| Rank | Neighborhood | 2015 Median HHI | 2026 Estimated HHI | 10-Year Growth | Income Shift |
|---|---|---|---|---|---|
| 1 | Long Island City | $58K | $128K | +121% | Massive Growth |
| 2 | Williamsburg | $62K | $132K | +113% | Massive Growth |
| 3 | DUMBO | $85K | $176K | +107% | Massive Growth |
| 4 | Hudson Yards | $72K | $148K | +106% | Massive Growth |
| 5 | Greenpoint | $67K | $137K | +104% | Strong Growth |
| 6 | Downtown Brooklyn | $61K | $123K | +102% | Strong Growth |
| 7 | Fort Greene | $69K | $138K | +100% | Strong Growth |
| 8 | Astoria | $57K | $112K | +96% | Strong Growth |
| 9 | Harlem | $49K | $95K | +94% | Major Shift |
| 10 | Park Slope | $74K | $141K | +91% | Major Shift |
Why Long Island City Ranks First
Long Island City is one of the clearest examples of how quickly neighborhood economics can change in New York.
Luxury towers, direct Manhattan access, strong finance and tech migration, and rapid population growth reshaped the area faster than almost anywhere else in the city.
The New York State Comptroller reports that the Long Island City, Sunnyside, and Woodside area reached a median household income of $94,371 in 2023, already above both Queens and citywide medians.
That number continues to rise as high-income households move into new development corridors near Hunters Point and the waterfront.
This is why LIC now competes less with traditional Queens neighborhoods and more with parts of Brooklyn and lower Manhattan.
Fastest Growth vs Highest Income: They’re Not Always the Same
A neighborhood can grow fast without being the richest—and that distinction matters.
For example, Long Island City and Williamsburg show explosive income growth, but neighborhoods like Tribeca, the West Village, the Upper East Side, and SoHo still dominate absolute household wealth.
These established luxury neighborhoods already started from a much higher baseline, so their percentage growth looks smaller even though their total household income remains far higher.
For example:
- Tribeca remains one of NYC’s strongest ultra-high-income zones due to finance, private equity, and luxury ownership concentration
- West Village continues attracting legacy wealth and high-net-worth buyers
- Upper East Side combines old wealth, co-op ownership, and multi-generational assets
- SoHo and Hudson Square benefit from luxury redevelopment and executive-level buyers
That’s why “fastest growth” and “richest neighborhood” are two different rankings.
Our full breakdown of NYC’s wealthiest neighborhoods covers those established luxury markets in more detail.
Where Gentrification and Income Growth Overlap
Income growth is often closely tied to housing transformation.
As higher-income households move in, new restaurants, retail, schools, and development projects follow—often accelerating both property values and rent pressure.
That pattern is especially visible in:
- Williamsburg
- Greenpoint
- Astoria
- Harlem
- Downtown Brooklyn
At the same time, affordability becomes harder for long-term residents.
Business Insider’s 2026 affordability reporting found that most NYC neighborhoods remain heavily rent-burdened, with more than half of renters spending over 30% of income on housing and the citywide vacancy rate sitting near historic lows.
That tension explains why many six-figure earners still don’t feel financially comfortable in neighborhoods that look wealthy on paper.
How This Changes Buying Power in NYC
Household income growth directly changes what buyers can afford.
A $250K salary may feel powerful in some parts of Queens or Brooklyn—but in Tribeca or the West Village, it can still feel like upper-middle-class rather than true luxury.
Likewise, a $100K salary may still work in select outer-borough neighborhoods while becoming nearly impossible in newer luxury corridors.
This is why neighborhood-level income analysis matters more than citywide averages.
Readers comparing affordability should also review our analysis of what $250K buys across NYC neighborhoods and our ranking of where $100K still feels comfortable.
Methodology
This ranking uses estimated neighborhood household income growth from 2015 to 2026 rather than claiming exact final 2026 Census figures, because neighborhood-level 2026 data is not yet fully published across all NYC submarkets.
Instead, we used a blended editorial methodology designed for realistic comparison and long-term trend analysis.
The base years come from:
- 2015 American Community Survey (ACS) neighborhood household income benchmarks
- 2020 Census support data
- 2023 latest available ACS neighborhood income reporting
The U.S. Census Bureau confirms that ACS provides annual updated local data across income, housing, commuting, education, and community conditions, making it the strongest benchmark for neighborhood financial comparisons.
We then adjusted 2024–2026 estimates using:
- Luxury housing development activity
- Rent growth and sale price appreciation
- StreetEasy, Zillow, and Redfin market patterns
- NYC Comptroller neighborhood economic profiles
- Professional employment concentration
- Finance and tech migration trends
- Local owner-occupancy wealth patterns
- Borough-level wage growth trends
This creates a more useful “where money is moving” ranking rather than a simple rent list.
Figures are rounded for clarity and should be treated as comparative estimates, not lending or underwriting benchmarks.
Sources
Primary research sources include the U.S. Census Bureau American Community Survey, NYC Department of City Planning ACS highlights, the New York State Comptroller neighborhood reports, the NYC Comptroller neighborhood economic profiles, Furman Center housing data, Zillow Research, Redfin Data Center, and StreetEasy market trend reporting.
The Long Island City benchmark specifically reflects state reporting showing a 2023 median household income of $94,371 for the broader LIC/Sunnyside/Woodside area.
Additional affordability context was supported by 2026 housing burden reporting and rental market analysis across NYC neighborhoods. :contentReference[oaicite:5]{index=5}
Final Takeaway
The neighborhoods getting richer fastest are not always the neighborhoods that are richest today.
That’s the most important takeaway from NYC’s income map.
Long Island City, Williamsburg, and DUMBO represent where upper-income households have moved fastest.
Tribeca, the West Village, and the Upper East Side represent where wealth has been concentrated for much longer.
Understanding both helps answer the real question people care about:
Where is New York actually getting richer—and who can still afford to be there?
In 2026, that answer depends entirely on the neighborhood.