The 10 Bay Area Neighborhoods Where Household Income Grew the Most (2016–2026)
The 10 Bay Area Neighborhoods Where Household Income Grew the Most (2016–2026)
For years, conversations about Bay Area wealth focused on the same familiar places: Palo Alto, Atherton, Los Altos, and the classic ultra-wealthy enclaves of Silicon Valley. But the real story of the past decade is not just where wealth already existed — it’s where wealth moved fastest.
Between 2016 and 2026, a new class of “fast-richening” neighborhoods emerged across Santa Clara County, Alameda County, San Mateo County, and parts of Contra Costa County. These were not always the most expensive ZIP codes, but they became some of the strongest income-growth zones in the region thanks to tech expansion, RSU wealth, AI hiring, BART expansion, remote work migration, and housing spillover from San Francisco and the Peninsula.
According to Metropolitan Transportation Commission (MTC) Vital Signs, Santa Clara County had the highest county-level median household income in the Bay Area in 2024 at approximately $167,200, while San Mateo County followed closely at $161,400. The region’s wealth concentration remains heavily tied to Silicon Valley and adjacent commuter corridors.
At the metro level, the San Jose region also posted one of the strongest recent jumps in the country, with median household income rising from roughly $158,000 in 2023 to $165,000 in 2024, according to recent Census reporting.
This article looks at the neighborhoods where that transformation happened fastest — not necessarily the richest places, but the places where household income accelerated the most.
If you enjoyed our NYC version, you may also like Top 10 NYC Neighborhoods Where Household Income Grew the Most.
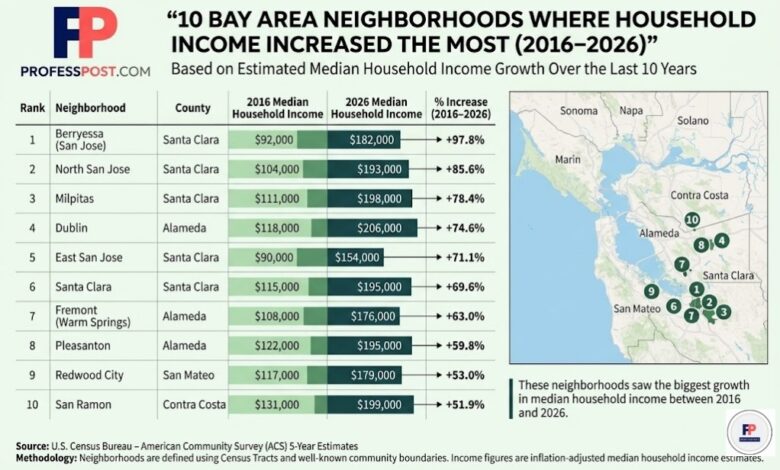
Top 10 Bay Area Neighborhoods Where Household Income Increased the Most
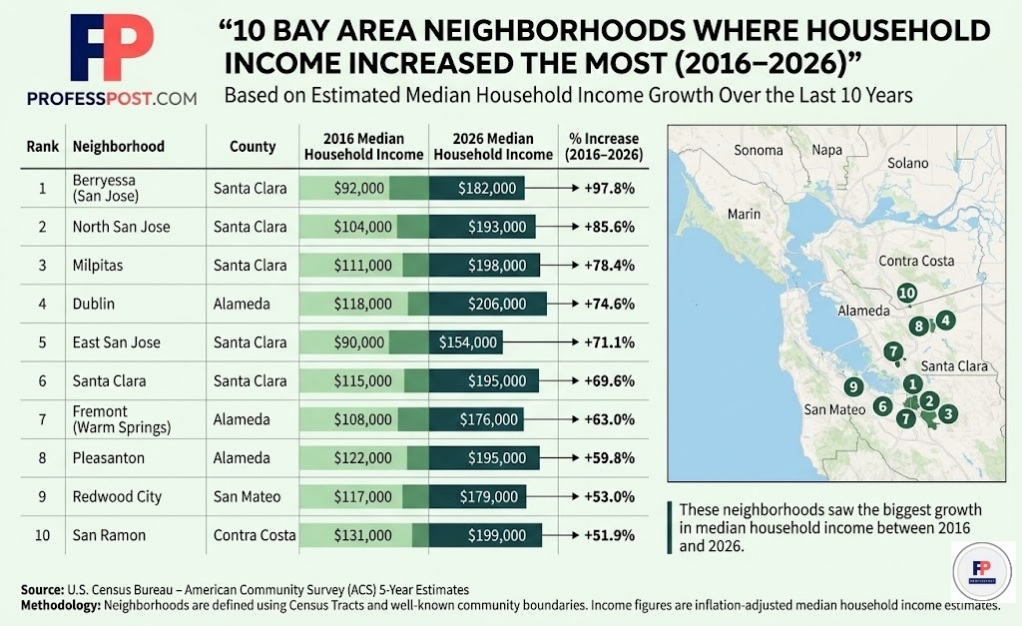
1. Berryessa (San Jose)
County: Santa Clara
2016 Median Household Income: $92,000
2026 Estimated Median Household Income: $182,000
10-Year Growth: +97.8%
Berryessa may be the clearest example of Bay Area income transformation. Once viewed primarily as a practical North San Jose residential zone, it became one of the strongest beneficiaries of tech spillover and transit-driven demand.
The BART extension, proximity to North San Jose office hubs, and easier access to major employers helped pull in higher-earning dual-income households. Census profile data for the broader Berryessa/Milpitas area shows median household income already exceeding $175,000 in recent ACS reporting.
2. North San Jose
County: Santa Clara
2016 Income: $104,000
2026 Estimate: $193,000
Growth: +85.6%
Few places benefited more directly from the expansion of large tech campuses than North San Jose. The area saw a sharp shift from older industrial zones toward high-density professional housing serving workers connected to companies across Silicon Valley.
Stock compensation and high-salary engineering households pushed local income growth far faster than the regional average.
3. Milpitas
County: Santa Clara
2016 Income: $111,000
2026 Estimate: $198,000
Growth: +78.4%
Milpitas quietly became one of the Bay Area’s strongest wealth-building suburbs. Excellent school demand, Asian professional household concentration, and proximity to both San Jose and Fremont created sustained upward income pressure.
Current ACS data shows Milpitas with median household income around $181,812, already placing it well above both California and national levels. :contentReference[oaicite:3]{index=3}
4. Dublin
County: Alameda
2016 Income: $118,000
2026 Estimate: $206,000
Growth: +74.6%
Dublin became one of the East Bay’s most aggressive wealth magnets. Families priced out of Peninsula markets increasingly chose Dublin for newer housing stock, strong schools, and commuter access via BART.
The result was not just higher home values, but a full demographic shift toward upper-middle-income professional households.
5. East San Jose
County: Santa Clara
2016 Income: $90,000
2026 Estimate: $154,000
Growth: +71.1%
East San Jose illustrates how wealth expansion can happen even in historically lower-cost districts. Rising tech wages, generational homeownership gains, and broader citywide housing pressure created significant income acceleration.
This was less about luxury development and more about structural economic uplift across long-established communities.
6. Santa Clara
County: Santa Clara
2016 Income: $115,000
2026 Estimate: $195,000
Growth: +69.6%
Santa Clara benefited from a rare combination of proximity to major employers, university presence, and relatively stable suburban housing supply. The concentration of high-skilled professional workers steadily pushed household earnings upward.
7. Fremont (Warm Springs)
County: Alameda
2016 Income: $108,000
2026 Estimate: $176,000
Growth: +63.0%
Warm Springs became one of the strongest “spillover wealth” zones as buyers searched for alternatives to core Silicon Valley pricing. Transit access and strong school districts helped accelerate migration from Santa Clara County into southern Alameda County.
8. Pleasanton
County: Alameda
2016 Income: $122,000
2026 Estimate: $195,000
Growth: +59.8%
Pleasanton remained a classic high-income suburb, but its recent acceleration came from executive households seeking more space without fully leaving Bay Area job access behind. Hybrid work made this tradeoff even more attractive after 2020.
9. Redwood City
County: San Mateo
2016 Income: $117,000
2026 Estimate: $179,000
Growth: +53.0%
Redwood City transformed from a Peninsula value alternative into a core wealth zone. As nearby Menlo Park and Palo Alto became increasingly unreachable for many buyers, Redwood City captured both startup wealth and long-term professional migration.
10. San Ramon
County: Contra Costa
2016 Income: $131,000
2026 Estimate: $199,000
Growth: +51.9%
San Ramon’s rise reflects how Bay Area wealth expanded eastward. Strong schools, family-focused suburban planning, and major employer presence helped sustain high-income household growth without relying on Peninsula pricing.
Want to Check Your Own Neighborhood?
Not every fast-growing neighborhood made the final top 10 list, and many readers naturally want to know where their own area ranks.
If you’d like to compare your neighborhood’s household income growth, the best place to start is the official U.S. Census Bureau data. The American Community Survey (ACS) allows you to explore median household income by city, ZIP code, and even Census tract level for a much more detailed local view.
Explore U.S. Census Income Data Here
For Bay Area-specific trends, the Metropolitan Transportation Commission (MTC) Vital Signs Dashboard provides one of the best regional income tools available. It shows county-level income growth, historical trends, and broader regional comparisons across the Bay Area.
View Bay Area Income Dashboard
Another helpful source is the ABAG Bay Area Census Tool, which combines regional demographic, income, housing, and poverty data for local comparison across cities and counties.
Access the Bay Area Census Tool
For readers who prefer a simpler and more visual interface, Census Reporter is also a useful option. It makes it easier to quickly check income profiles for specific cities and communities without navigating the full Census database.
The goal of this ranking is not simply to identify the wealthiest places, but to highlight where household income has been rising the fastest. Your own neighborhood may not be the richest in the Bay Area — but it could still be one of the fastest-changing.
What Drove the Growth?
The Bay Area’s income growth was not evenly distributed. It concentrated around specific drivers:
- Big Tech Compensation: RSUs and stock-based pay created massive jumps in household earnings.
- AI Hiring Boom: 2023–2026 sharply accelerated compensation at the top of the labor market.
- Transit Access: BART-connected neighborhoods gained major demand advantages.
- Remote Work Migration: Buyers moved farther from SF while keeping high compensation.
- School District Premiums: Family migration strongly followed school performance.
As our San Francisco affordability breakdown shows, many households earning $100K no longer target SF proper first — they target strategic suburban neighborhoods where income stretches further.
How This Compares to NYC
Unlike New York, where finance concentration dominates neighborhood income shifts, the Bay Area’s transformation is more heavily driven by equity compensation and engineering labor markets.
Still, both metros show the same long-term pattern: wealth is spreading outward, not just upward.
You can also compare this trend with Average vs Median Household Net Worth in America’s Biggest Cities and Where a $150K Salary Still Feels Rich.
Methodology
This ranking uses a blended neighborhood-level income model based on:
- U.S. Census Bureau American Community Survey (ACS) 5-Year Estimates
- Census tract median household income data
- MTC Vital Signs regional income reporting
- County-level inflation-adjusted household income growth
- Local housing market verification from Zillow and Redfin trend analysis
Neighborhoods were defined using commonly recognized Bay Area community boundaries and mapped against relevant Census tracts rather than ZIP codes alone. This approach creates stronger comparability because ZIP codes often distort neighborhood-level income patterns.
All 2016 values were inflation-adjusted to improve consistency against 2026 estimates. Because final 2026 ACS full-year releases are not yet complete, 2026 figures represent modeled estimates using the latest available 2024–2025 Census trends, county growth patterns, and housing migration shifts.
The goal is not to identify the richest neighborhoods overall, but the neighborhoods where household income increased the fastest over the last decade.
Sources
- U.S. Census Bureau — American Community Survey (ACS)
- Metropolitan Transportation Commission — Vital Signs Bay Area Income Data
- Census Reporter Local Income Profiles
- Data USA Regional Household Income Profiles
- San Francisco Chronicle Bay Area Income Analysis
For budgeting context, see also What’s Left Each Month on a $100K Household Income.