How Much Property Taxes Increased in America’s Biggest Metro Areas Since 2016

How Much Property Taxes Increased in America’s Biggest Metro Areas Since 2016
For many homeowners, rising home values have been a source of wealth creation over the last decade. But there has been a tradeoff: higher property tax bills.
As home prices surged across much of the United States between 2016 and 2026, local governments collected larger tax revenues from increasingly valuable residential properties. In many metro areas, annual property tax bills on median-priced homes increased dramatically, adding thousands of dollars to the cost of homeownership.
Using estimated median home values and local effective property tax rates, we analyzed how annual property tax bills changed across America’s largest metro areas over the last decade.
Property Taxes Rose Alongside Home Values
The same housing boom that created wealth for homeowners also increased annual tax obligations in many parts of the country.
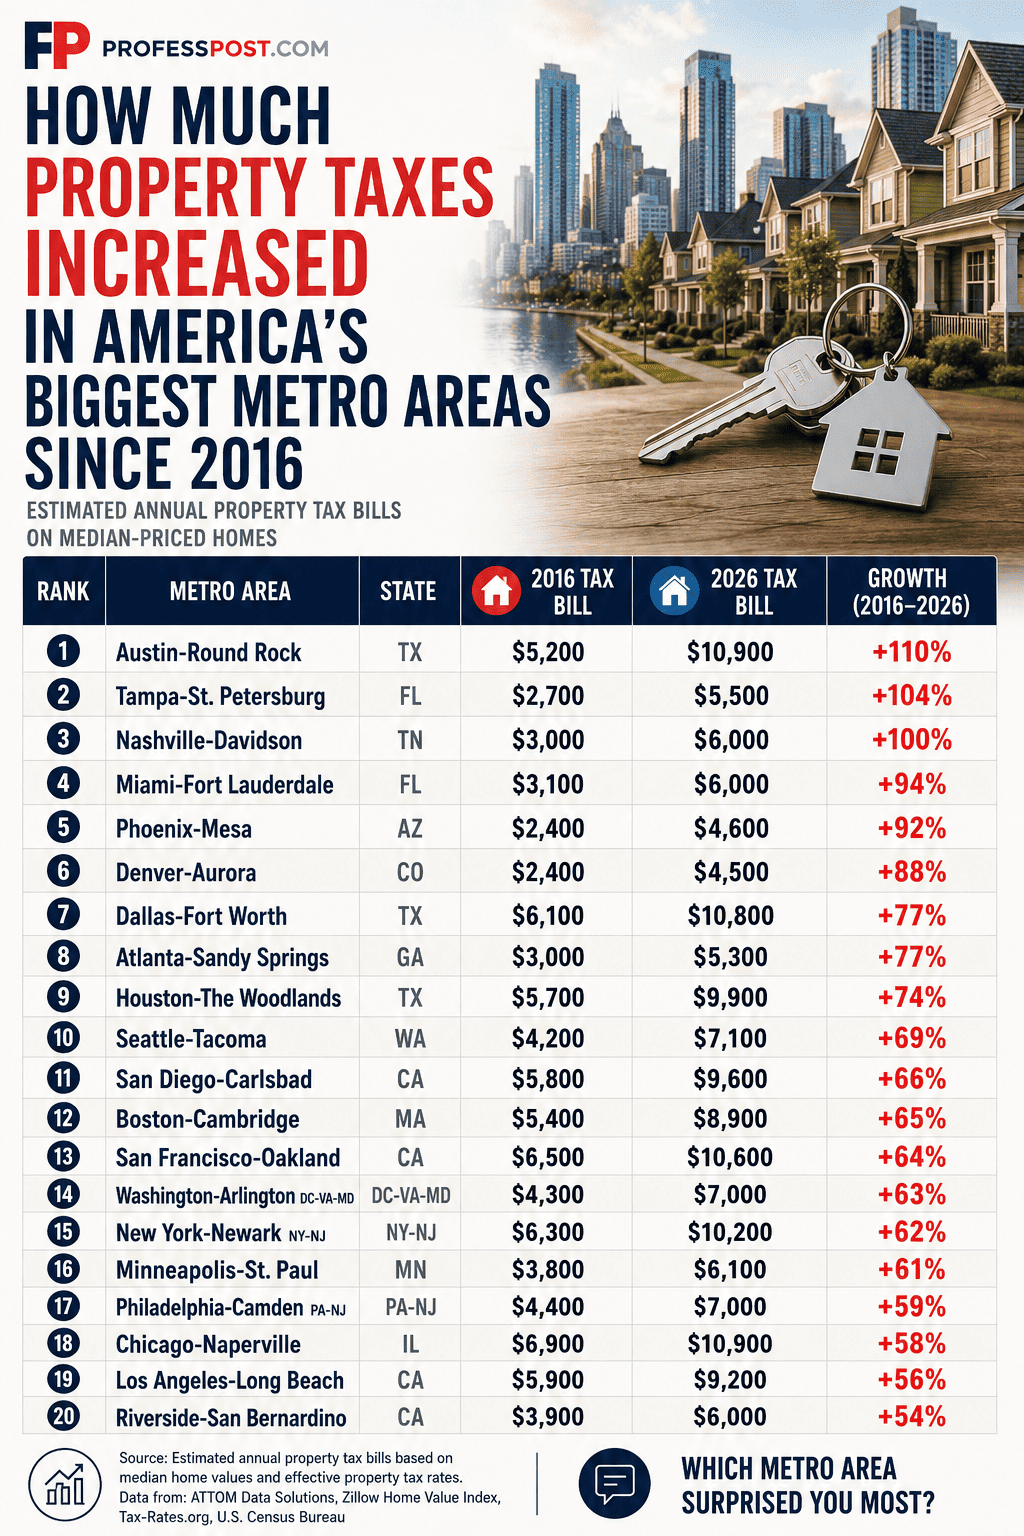
Austin ranked first in our analysis, with estimated annual property tax bills on median-priced homes rising from approximately $5,200 in 2016 to $10,900 in 2026 — an increase of 110%.
Tampa, Nashville, Miami, and Phoenix also experienced major increases as rapid population growth, housing demand, and home price appreciation pushed assessed values higher.
Many Sun Belt markets that attracted new residents during the pandemic years now face significantly higher ownership costs than they did a decade ago.
The Fastest-Rising Property Tax Bills
Several of the nation’s fastest-growing metro areas also posted the largest increases in property tax bills.
- Austin-Round Rock: +110%
- Tampa-St. Petersburg: +104%
- Nashville-Davidson: +100%
- Miami-Fort Lauderdale: +94%
- Phoenix-Mesa: +92%
While these markets generated substantial housing wealth for homeowners, rising tax bills have increasingly become part of the affordability conversation.
In many cases, homeowners are paying thousands of dollars more per year than they were just ten years ago.
High Home Values Often Mean Higher Tax Bills
Some of the country’s most expensive housing markets also continue to generate some of the highest annual property tax bills.
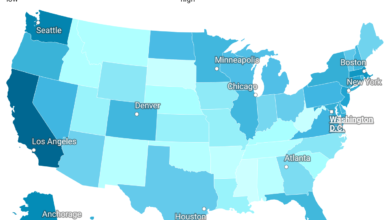
Metro areas such as San Francisco, New York, San Diego, Boston, and Seattle all rank among the most expensive places to buy a home in America.
Even though their percentage growth rates were lower than Austin or Tampa, homeowners in these metros often pay substantially larger annual tax bills in absolute dollar terms.
For example, the estimated annual property tax bill on a median-priced home now exceeds $10,000 in several major metro areas.
The Growing Cost of Homeownership
Property taxes are only one piece of the homeownership equation.
Homeowners today also face higher insurance premiums, maintenance costs, mortgage payments, and utility expenses than they did a decade ago.
Our analysis of home insurance costs as a share of household income shows how rising insurance expenses are creating additional financial pressure in many housing markets.
Together, these costs help explain why homeownership feels increasingly expensive despite rising household incomes.
Housing Wealth and the Property Tax Tradeoff
Many homeowners who saw higher tax bills also benefited from significant increases in housing wealth.
Luxury housing markets in particular experienced enormous appreciation over the last decade.
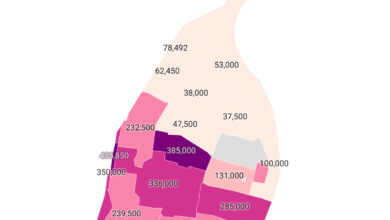
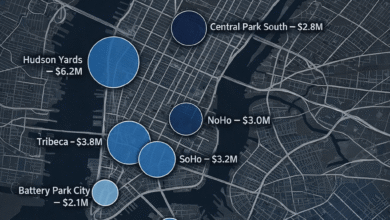
Our analysis of luxury ZIP code home values since 2016 highlights how dramatically some of America’s most valuable neighborhoods appreciated.
Likewise, our ranking of America’s richest ZIP codes in 2026 demonstrates how housing wealth remains heavily concentrated in a small number of elite communities.
For many households, rising property taxes were accompanied by far larger increases in home equity.
Renters Felt Housing Inflation Too
The effects of rising housing costs weren’t limited to homeowners.
Many cities that experienced significant home price appreciation also recorded major rent increases.
See our analysis of how much rent increased in America’s biggest cities since 2016 to compare how renters were affected during the same period.
Whether renting or owning, housing costs became one of the defining financial challenges of the last decade.
Full Rankings: Estimated Property Tax Bill Growth (2016–2026)
| Rank | Metro Area | 2016 Tax Bill | 2026 Tax Bill | Growth |
|---|---|---|---|---|
| 1 | Austin-Round Rock, TX | $5,200 | $10,900 | +110% |
| 2 | Tampa-St. Petersburg, FL | $2,700 | $5,500 | +104% |
| 3 | Nashville-Davidson, TN | $3,000 | $6,000 | +100% |
| 4 | Miami-Fort Lauderdale, FL | $3,100 | $6,000 | +94% |
| 5 | Phoenix-Mesa, AZ | $2,400 | $4,600 | +92% |
| 6 | Denver-Aurora, CO | $2,400 | $4,500 | +88% |
| 7 | Dallas-Fort Worth, TX | $6,100 | $10,800 | +77% |
| 8 | Atlanta-Sandy Springs, GA | $3,000 | $5,300 | +77% |
| 9 | Houston-The Woodlands, TX | $5,700 | $9,900 | +74% |
| 10 | Seattle-Tacoma, WA | $4,200 | $7,100 | +69% |
| 11 | San Diego-Carlsbad, CA | $5,800 | $9,600 | +66% |
| 12 | Boston-Cambridge, MA | $5,400 | $8,900 | +65% |
| 13 | San Francisco-Oakland, CA | $6,500 | $10,600 | +64% |
| 14 | Washington-Arlington, DC-VA-MD | $4,300 | $7,000 | +63% |
| 15 | New York-Newark, NY-NJ | $6,300 | $10,200 | +62% |
| 16 | Minneapolis-St. Paul, MN | $3,800 | $6,100 | +61% |
| 17 | Philadelphia-Camden, PA-NJ | $4,400 | $7,000 | +59% |
| 18 | Chicago-Naperville, IL | $6,900 | $10,900 | +58% |
| 19 | Los Angeles-Long Beach, CA | $5,900 | $9,200 | +56% |
| 20 | Riverside-San Bernardino, CA | $3,900 | $6,000 | +54% |
Final Takeaway
The last decade created enormous housing wealth across much of the United States, but it also brought significantly higher property tax bills.
In fast-growing metro areas such as Austin, Tampa, Nashville, and Miami, homeowners are paying dramatically more in annual property taxes than they were in 2016.
As home values continue rising across many housing markets, property taxes will remain an increasingly important factor in the true cost of homeownership.
Disclaimer: Figures shown are estimated annual property tax bills based on median home values and effective property tax rates. Values are intended for informational and editorial purposes only.