New York City, April 2025 — The latest poverty statistics for New York City paint a complex picture of economic disparity across its five boroughs.
Poverty level—also known as the poverty line or poverty threshold—is the minimum level of income deemed adequate to live in a particular country. In the U.S., it’s determined by the U.S. Census Bureau and is based on how much money a household needs to cover basic living expenses like food, housing, clothing, and transportation.
The poverty level varies by household size. For example, a single person will have a lower poverty threshold than a family of four.
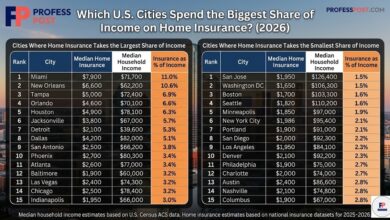
It’s adjusted annually for inflation. In 2025, for example, the federal poverty line for a single individual is approximately $15,000–$16,000 per year, while for a family of four, it’s around $30,000–$35,000 (these figures are rounded estimates).
It’s used to determine eligibility for public programs like Medicaid, SNAP (food stamps), housing assistance, and more. It helps researchers and policymakers understand economic inequality and allocate resources.
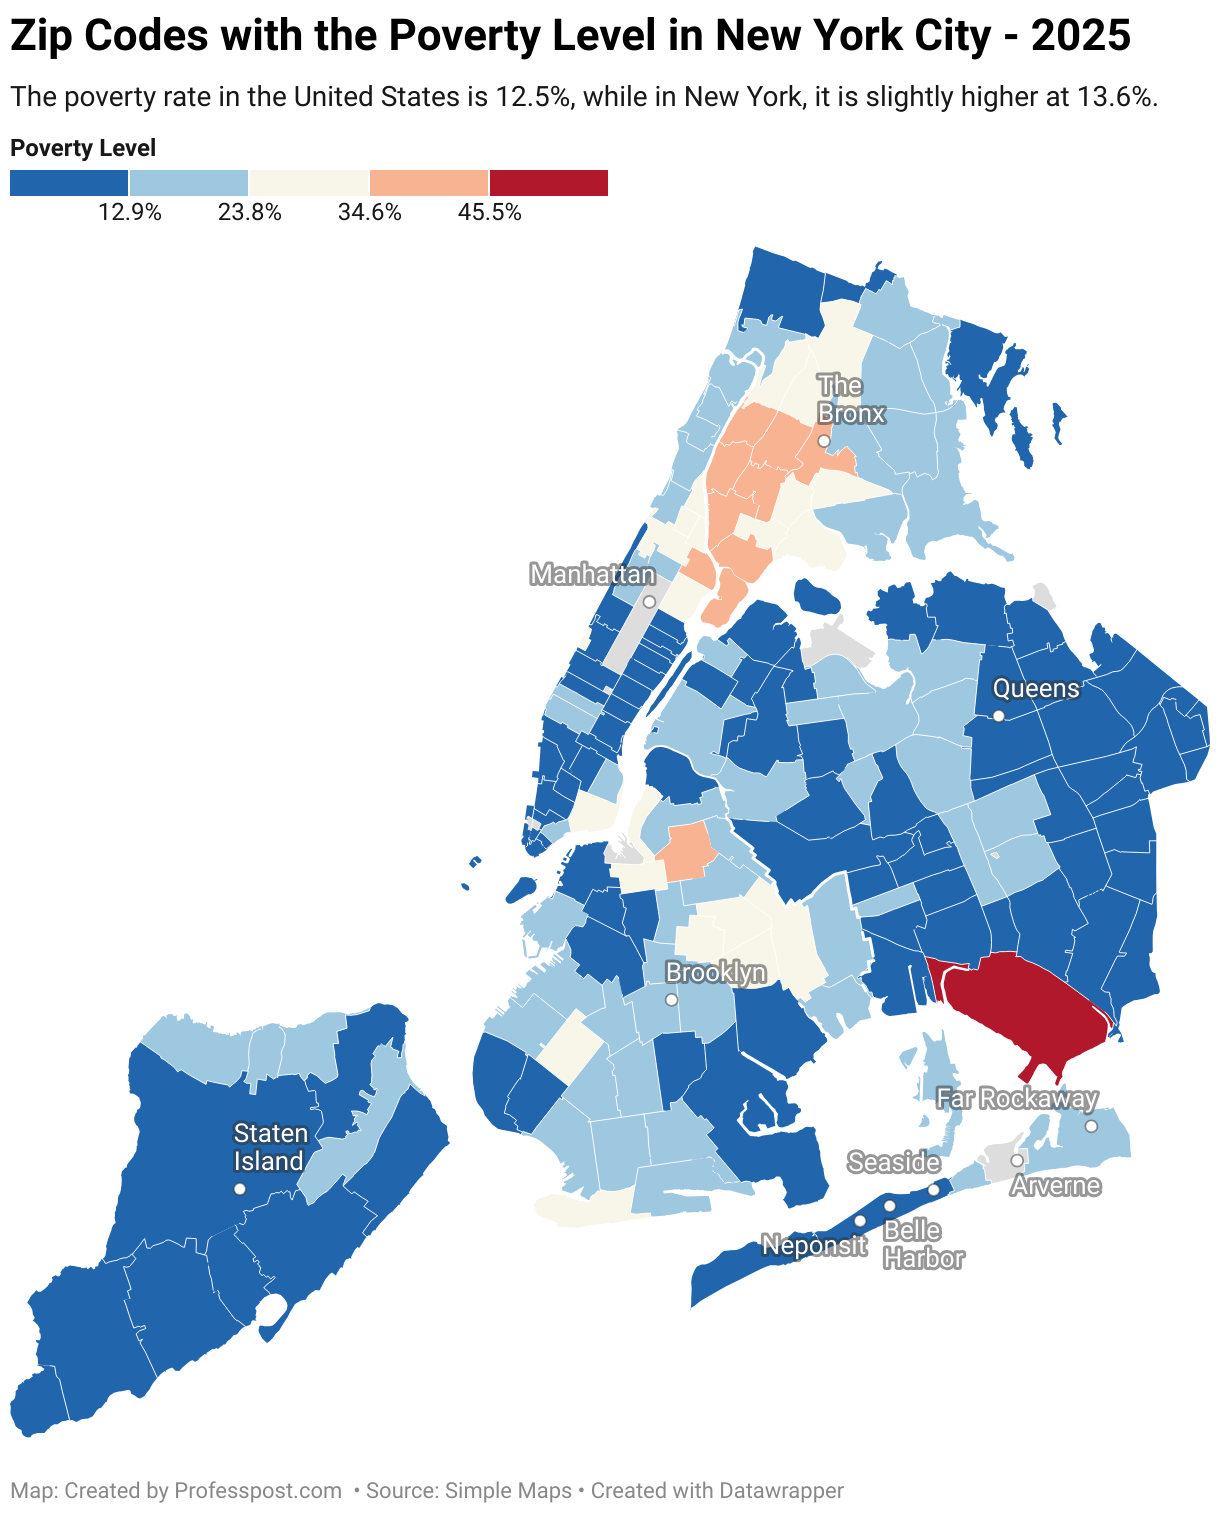
With rates ranging from a staggering 56.4% in parts of Queens to just 2.0% in trendy waterfront areas, the data highlights deeply entrenched inequalities that continue to shape daily life in the city.
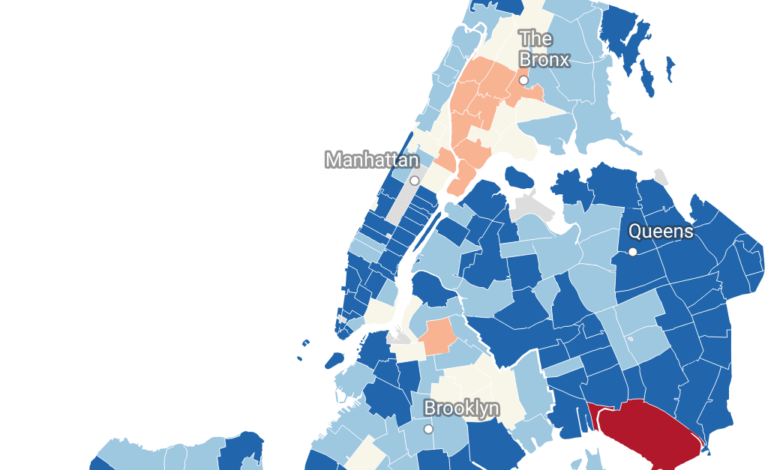
The Bronx remains the borough with the highest concentration of poverty. ZIP code 10454 (Mott Haven-Port Morris) tops the city with a poverty rate of 42.1%, followed closely by neighboring areas like 10451, 10452, and 10456 — all exceeding 36%. These neighborhoods have historically faced challenges related to underinvestment, housing insecurity, and limited access to high-paying jobs.
In contrast, wealthier Bronx ZIP codes like 10464 (City Island) report poverty rates as low as 4.2%, showcasing dramatic intra-borough disparities.
Brooklyn’s poverty landscape is split between gentrified zones and struggling communities. ZIP codes like 11206 (Bushwick/Williamsburg) and 11212 (Brownsville) report rates above 30%, while more affluent neighborhoods such as 11215 (Park Slope) and 11234 (Mill Basin) report rates under 10%.
Gentrification has brought new investments and rising property values in many parts of Brooklyn, but the benefits have not reached all residents equally.
Queens shows the highest poverty rate citywide in ZIP code 11430 — the area surrounding JFK Airport — at 56.4%, although this figure may be skewed due to the population base. Other neighborhoods like 11434 and 11355 report rates near or above 20%, reflecting challenges in immigrant-heavy communities.
Still, Queens also features pockets of economic stability, with areas such as 11362 (Little Neck) and 11411 (Cambria Heights) showing poverty levels below 6%.
Manhattan presents a striking juxtaposition. Harlem ZIP codes 10029 and 10030 hover around 30% poverty, while areas like the Financial District (10007) and Upper East Side (10021) boast single-digit rates — 2.2% and 4.2%, respectively.
This north-south divide reflects longstanding issues in urban planning, systemic inequality, and housing affordability.